The BioMIR app

A daily view.
Room to go deeper.

Start with your physiological picture. Follow each signal back to its measurements, explore what may be contributing, and observe how the pattern changes over time.

01 / Today

Understand the signal.
Choose your next step.

  • Adaptive BioAge

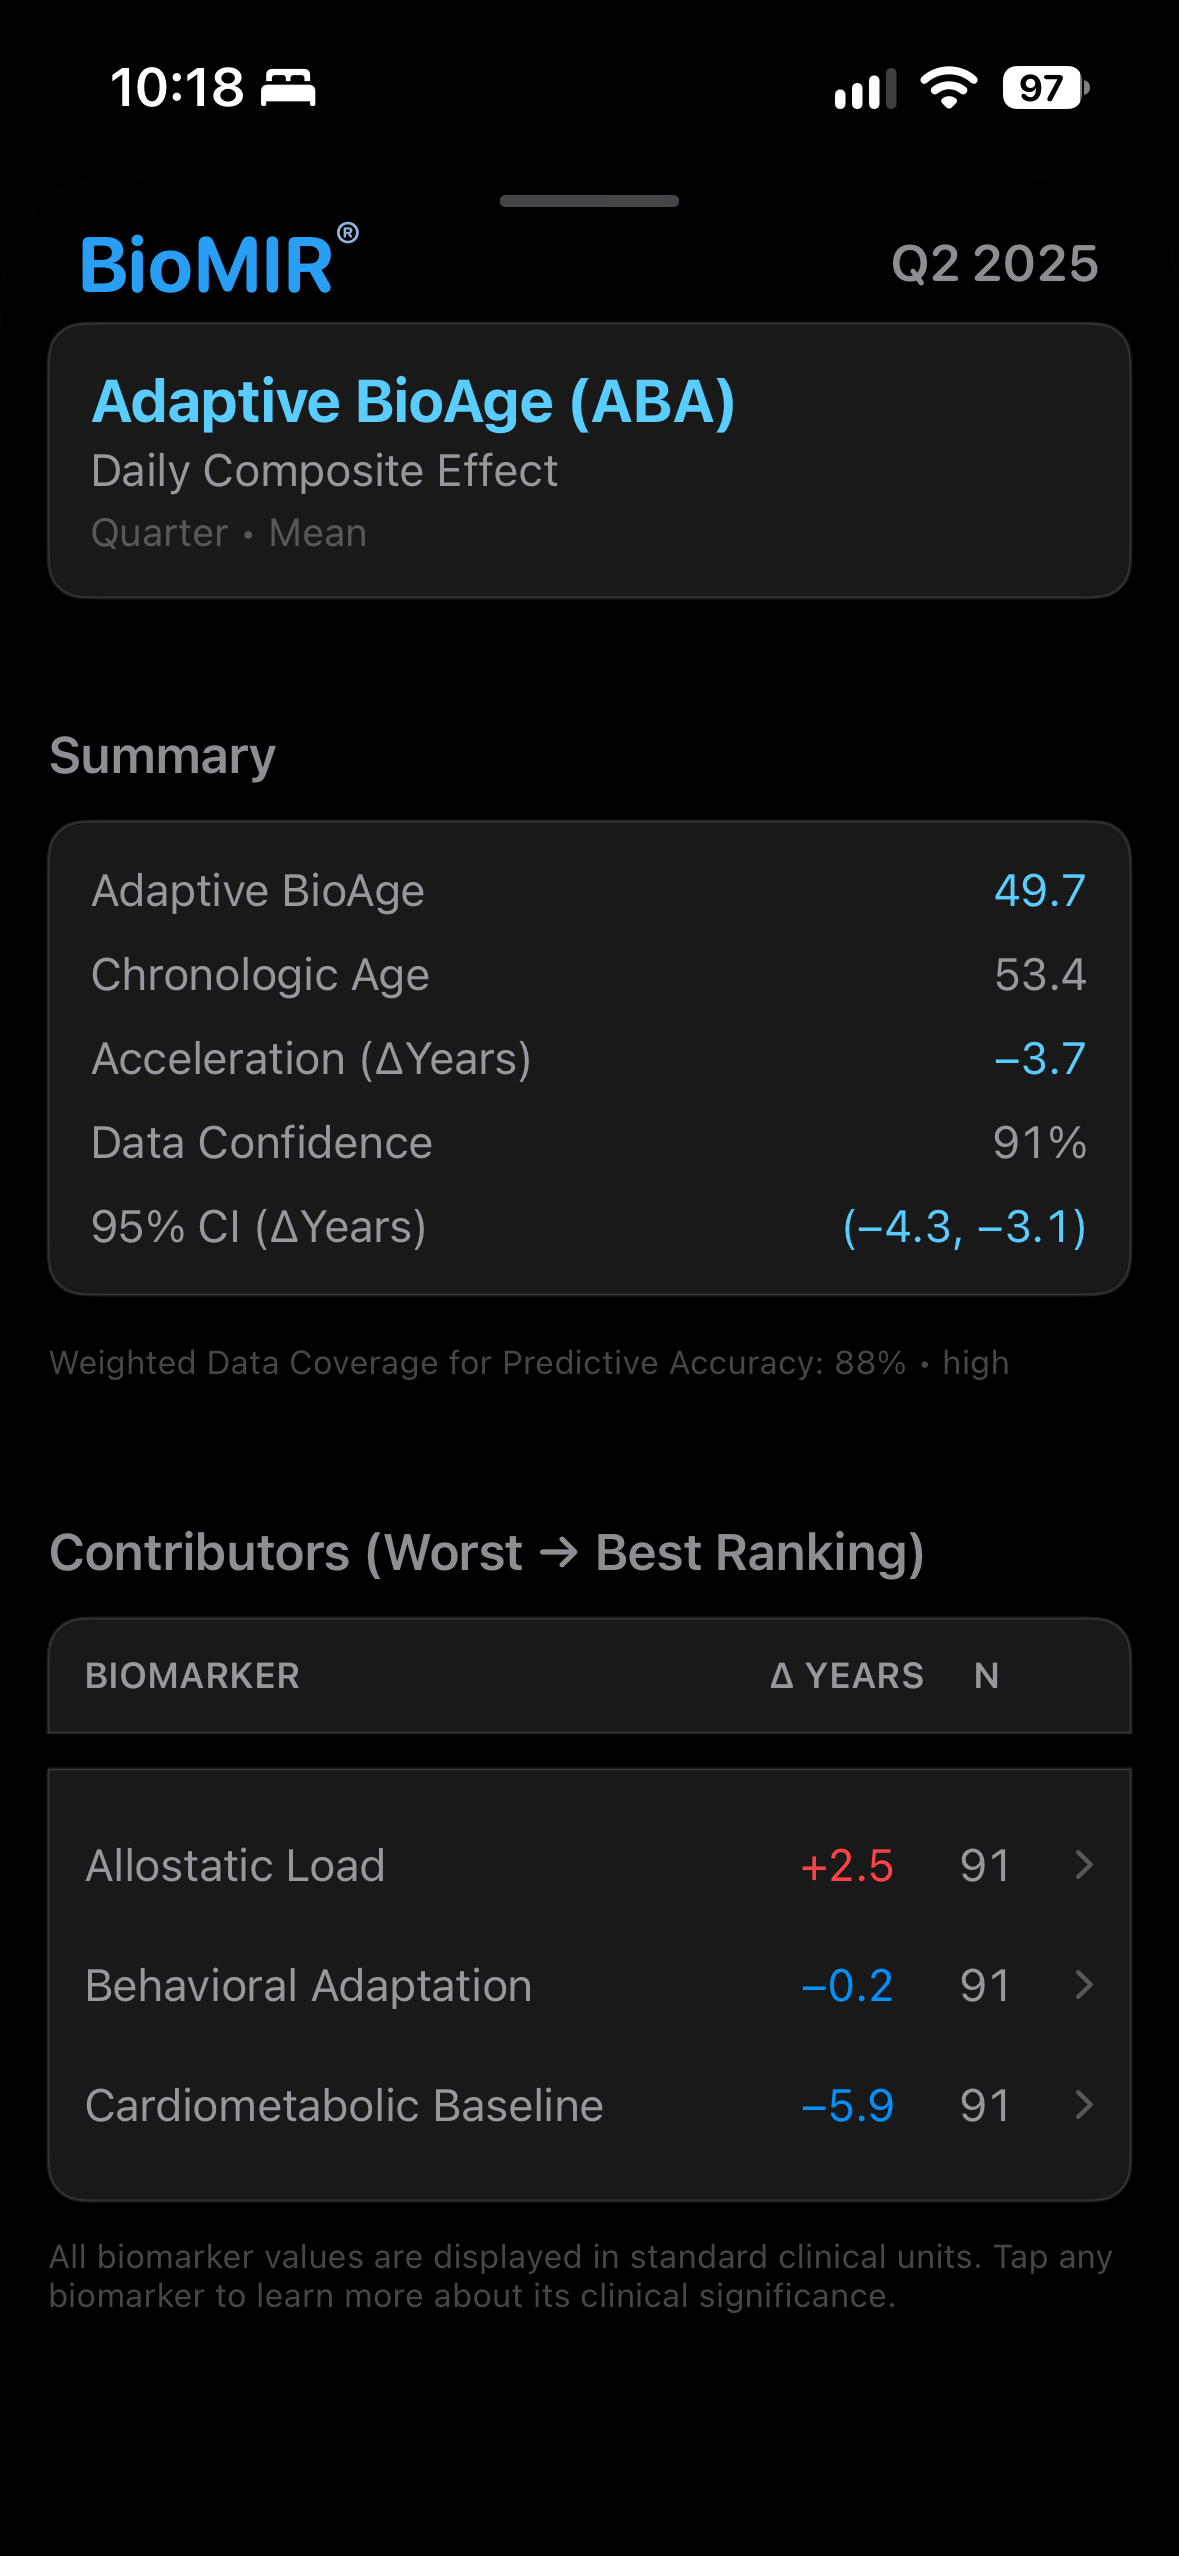
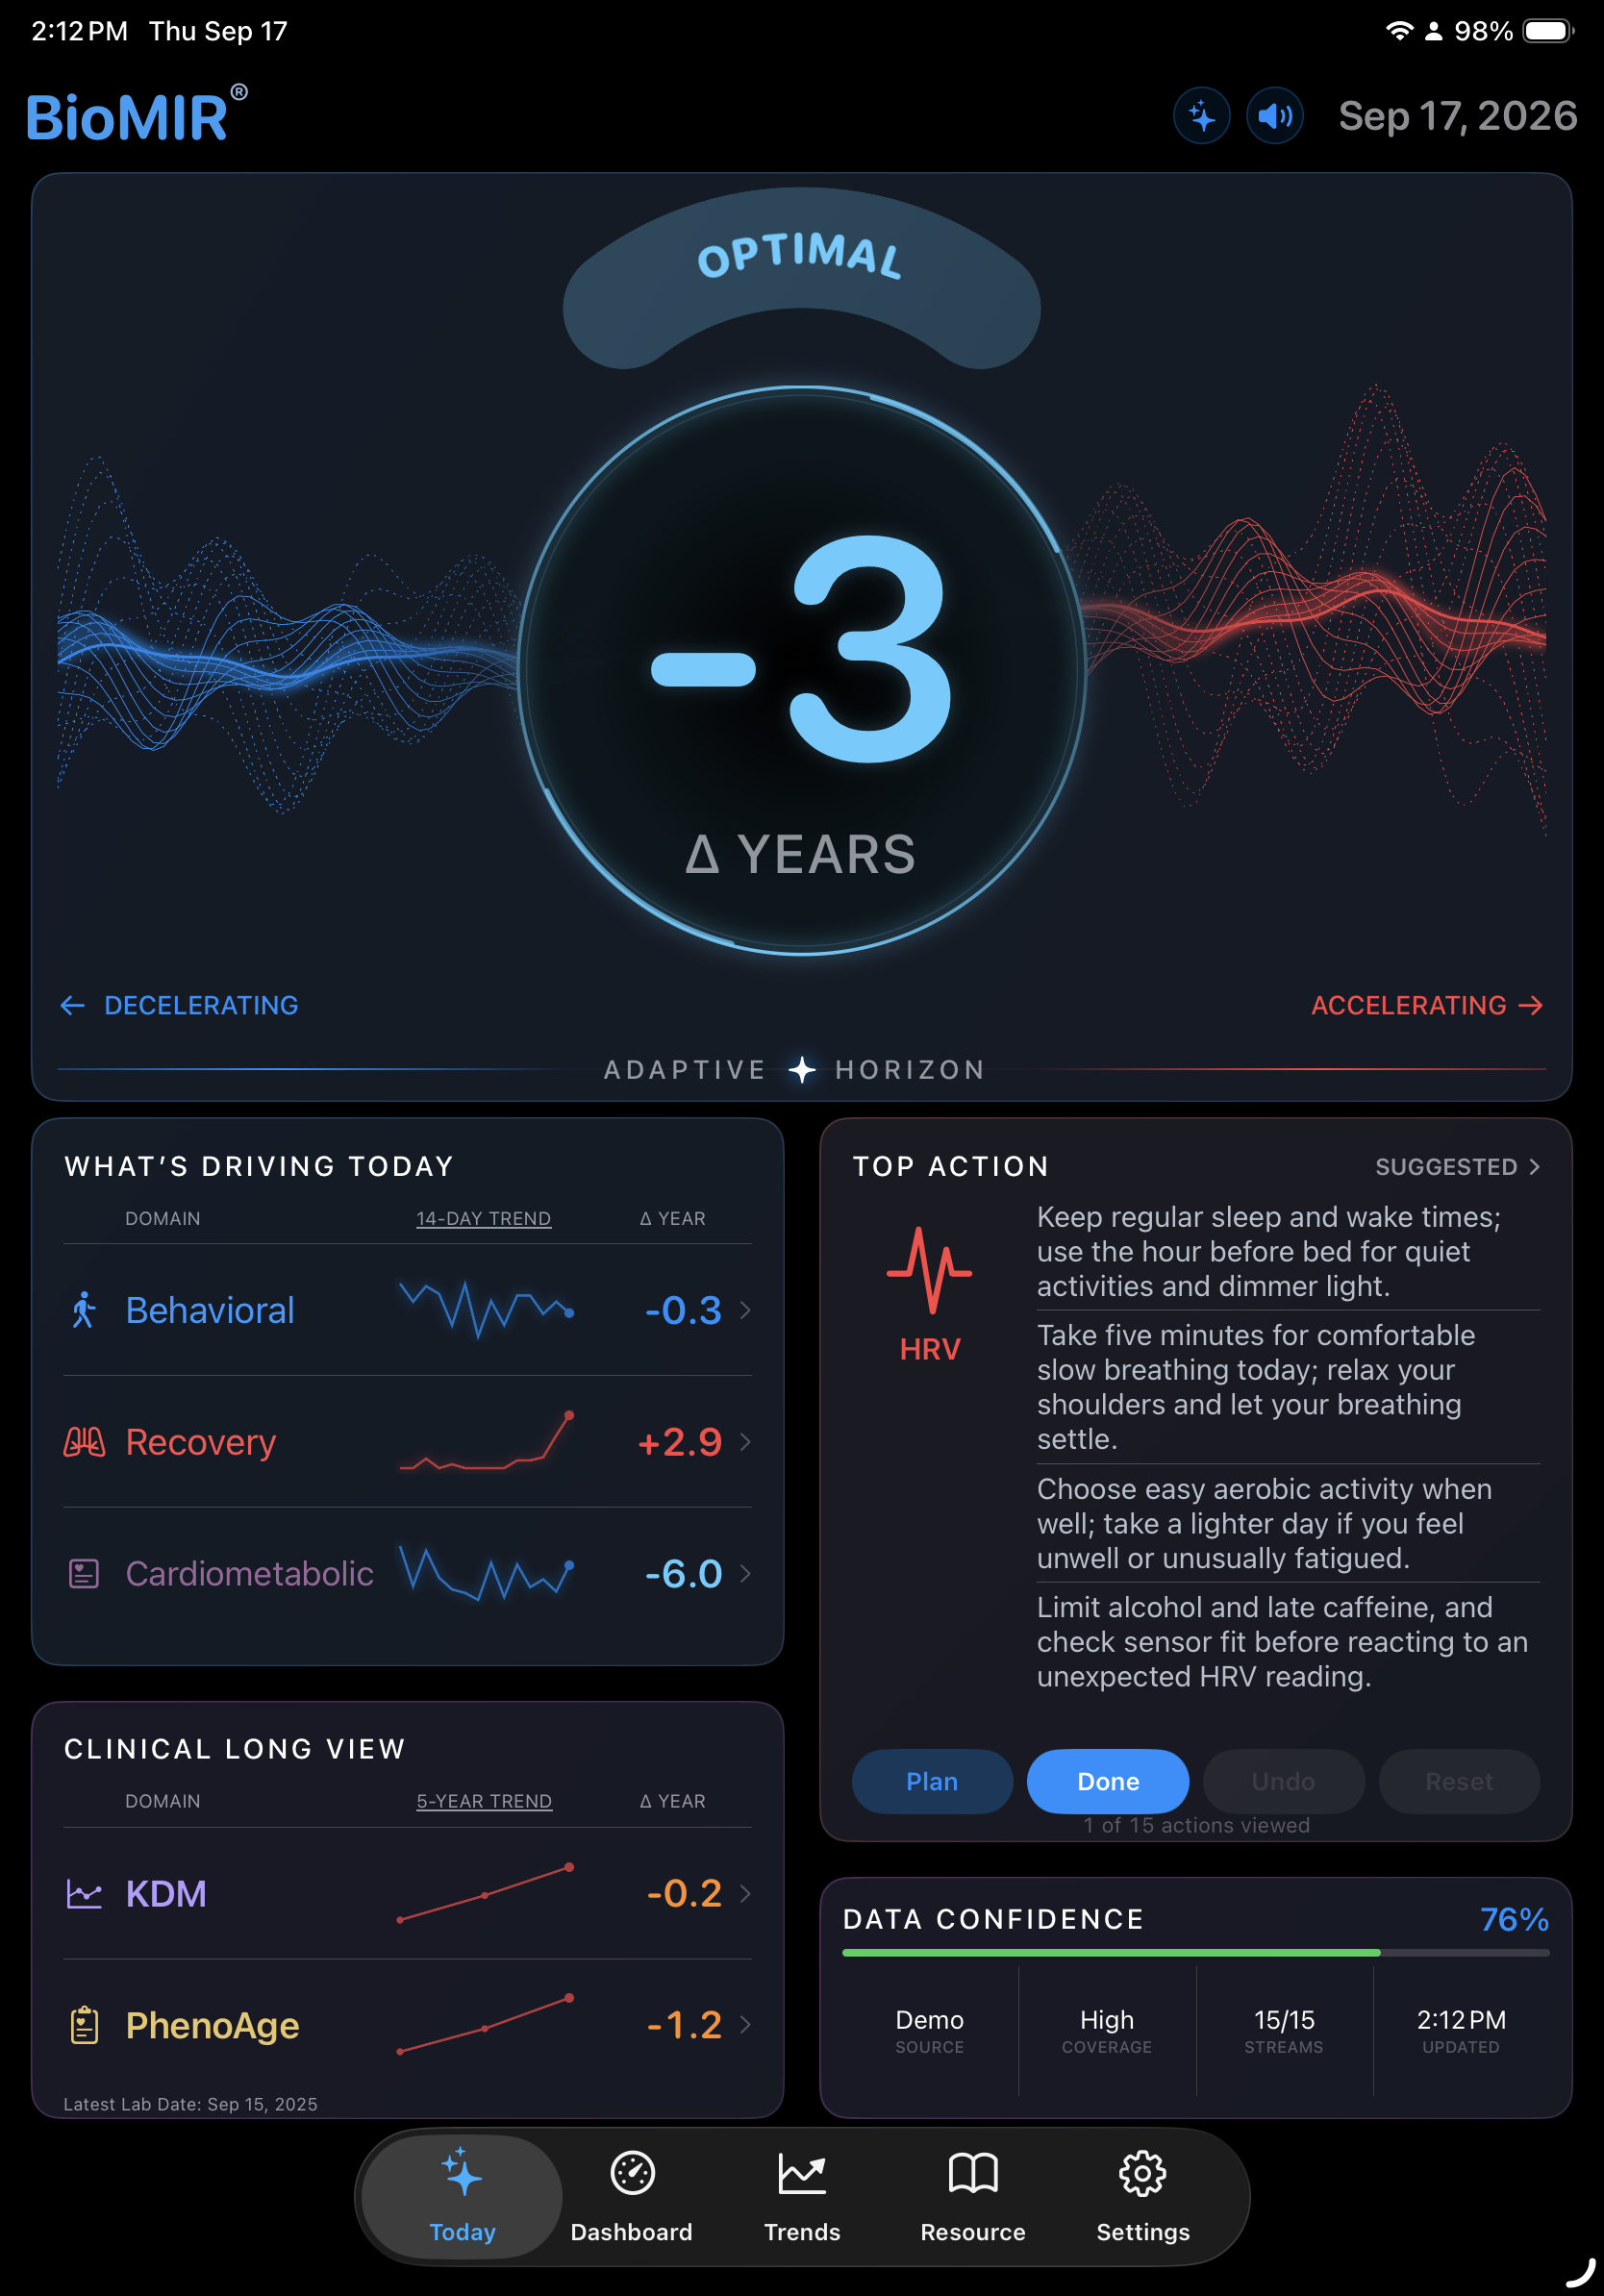
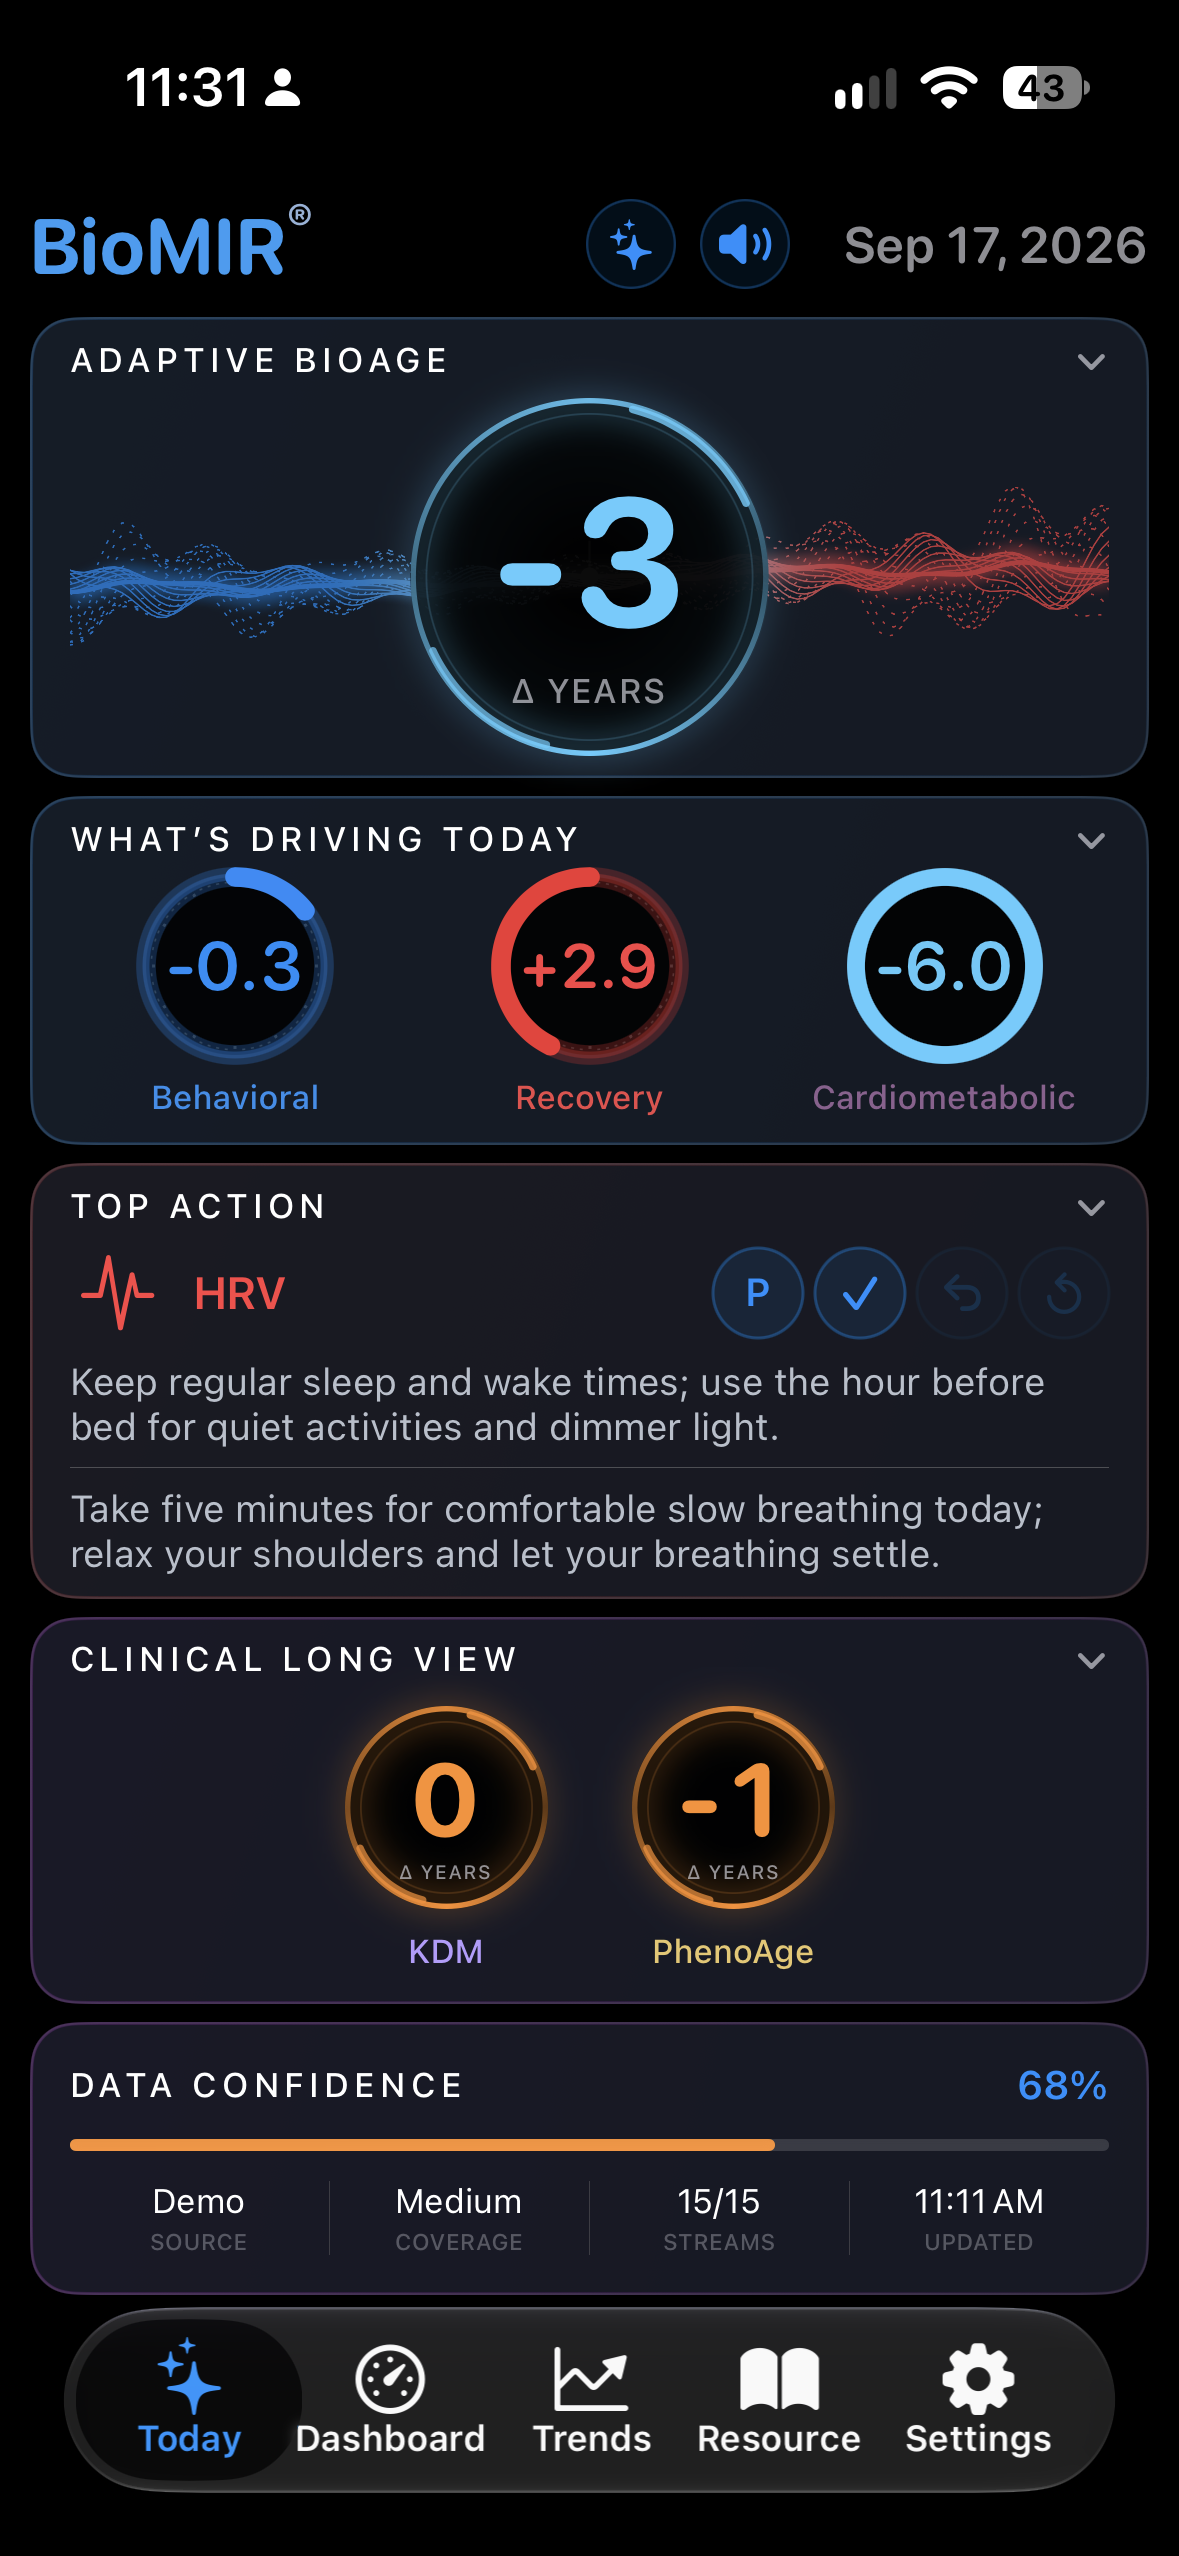
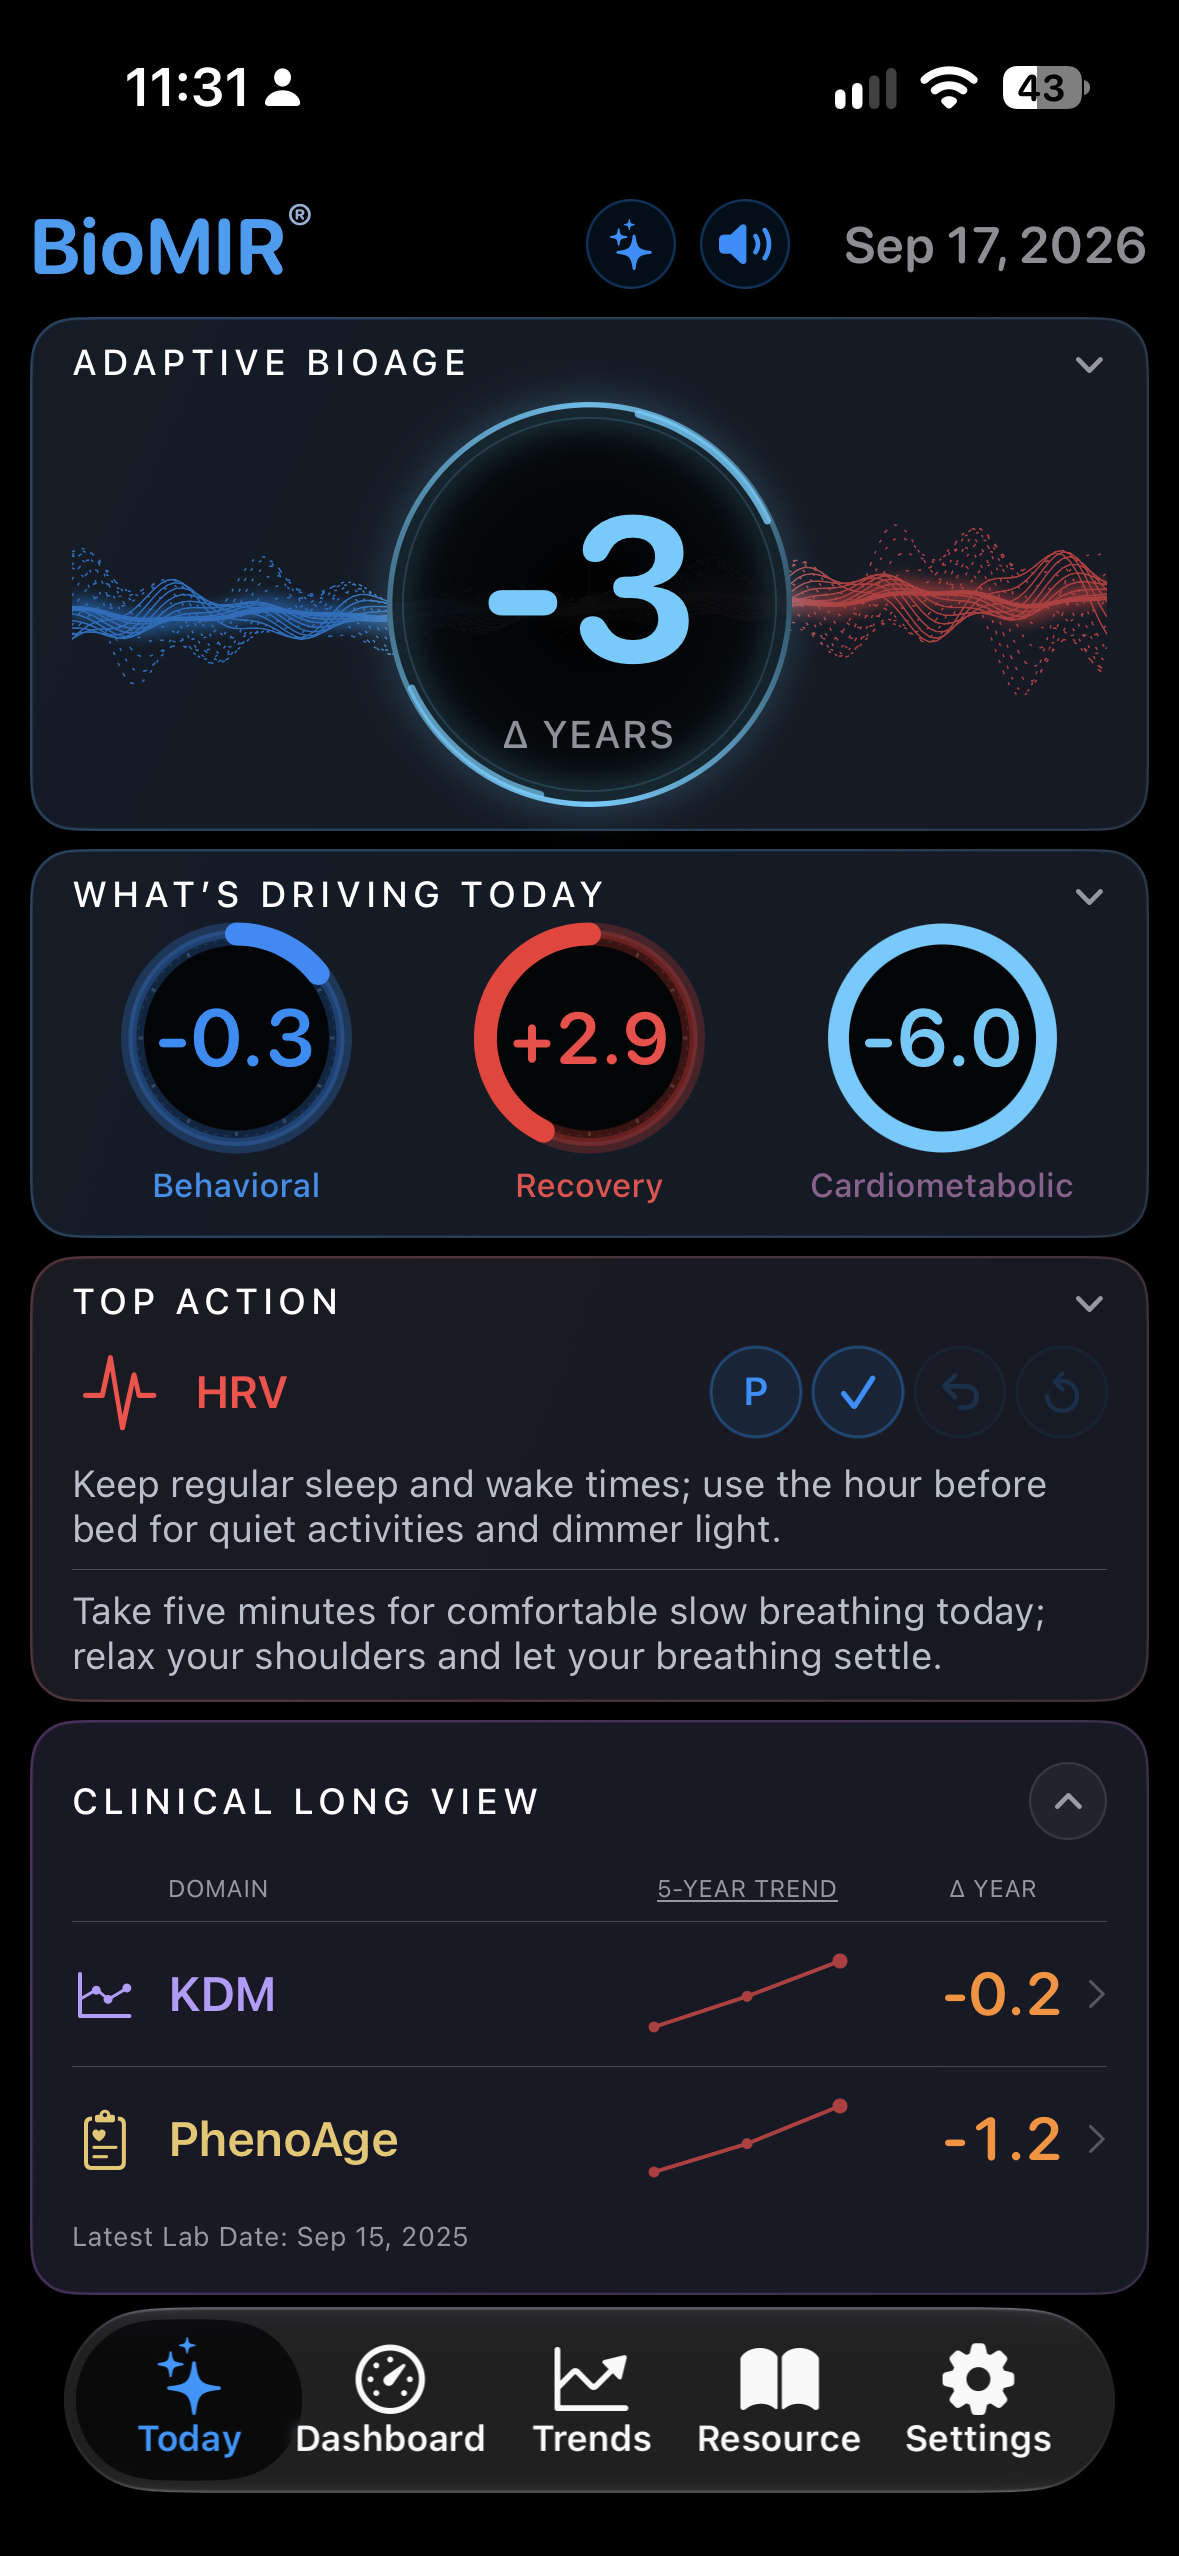
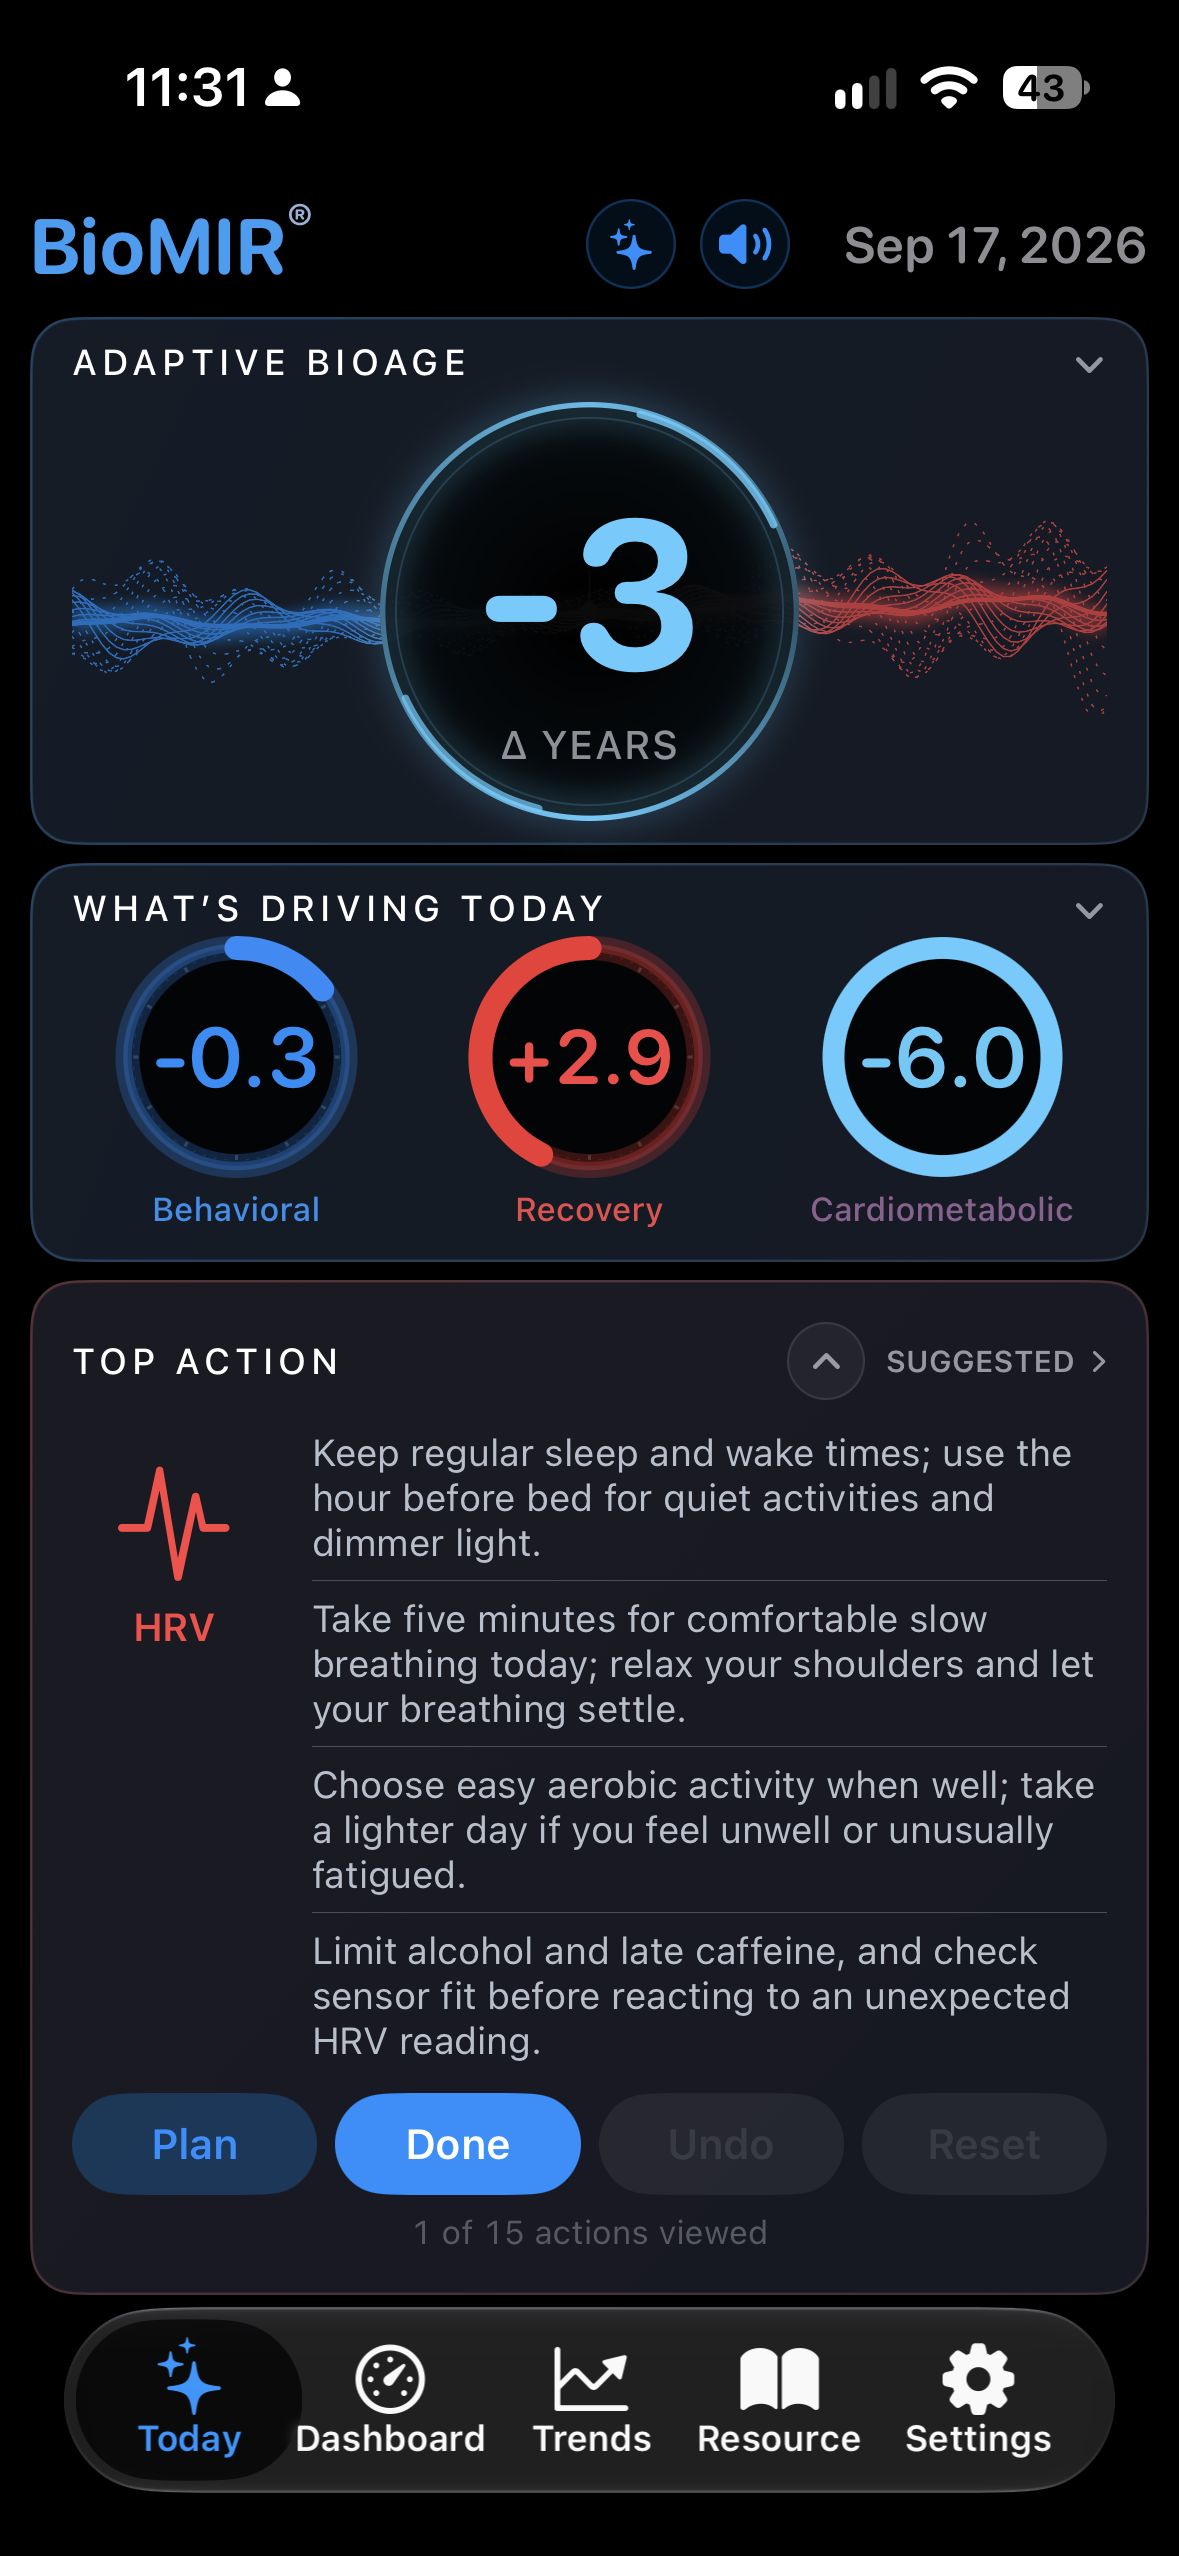
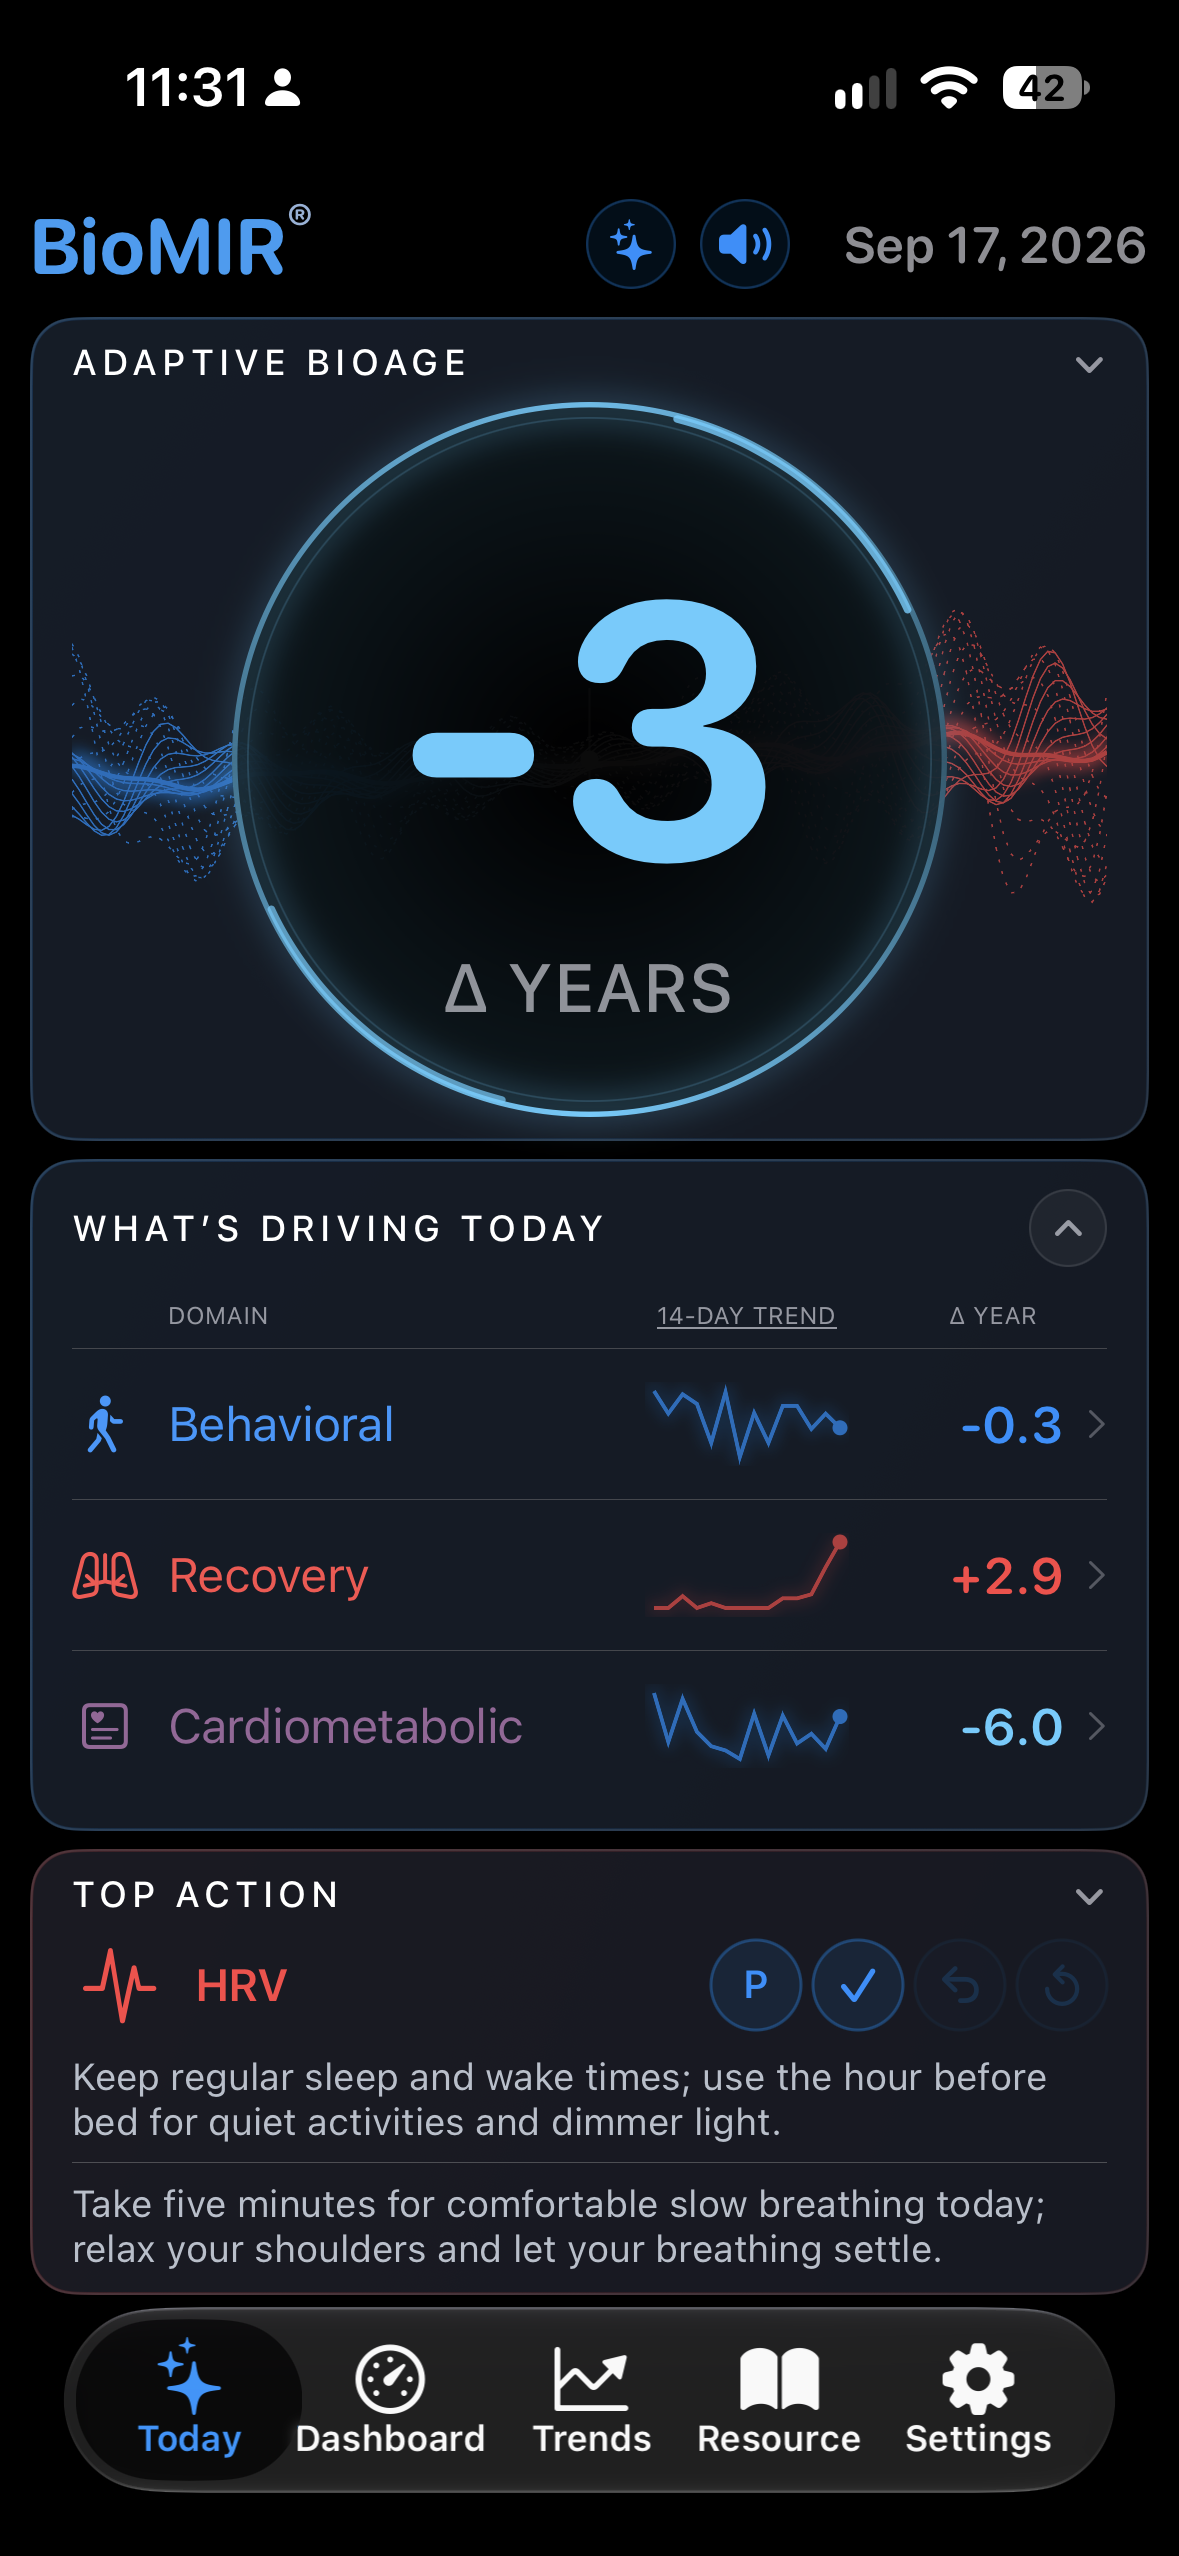
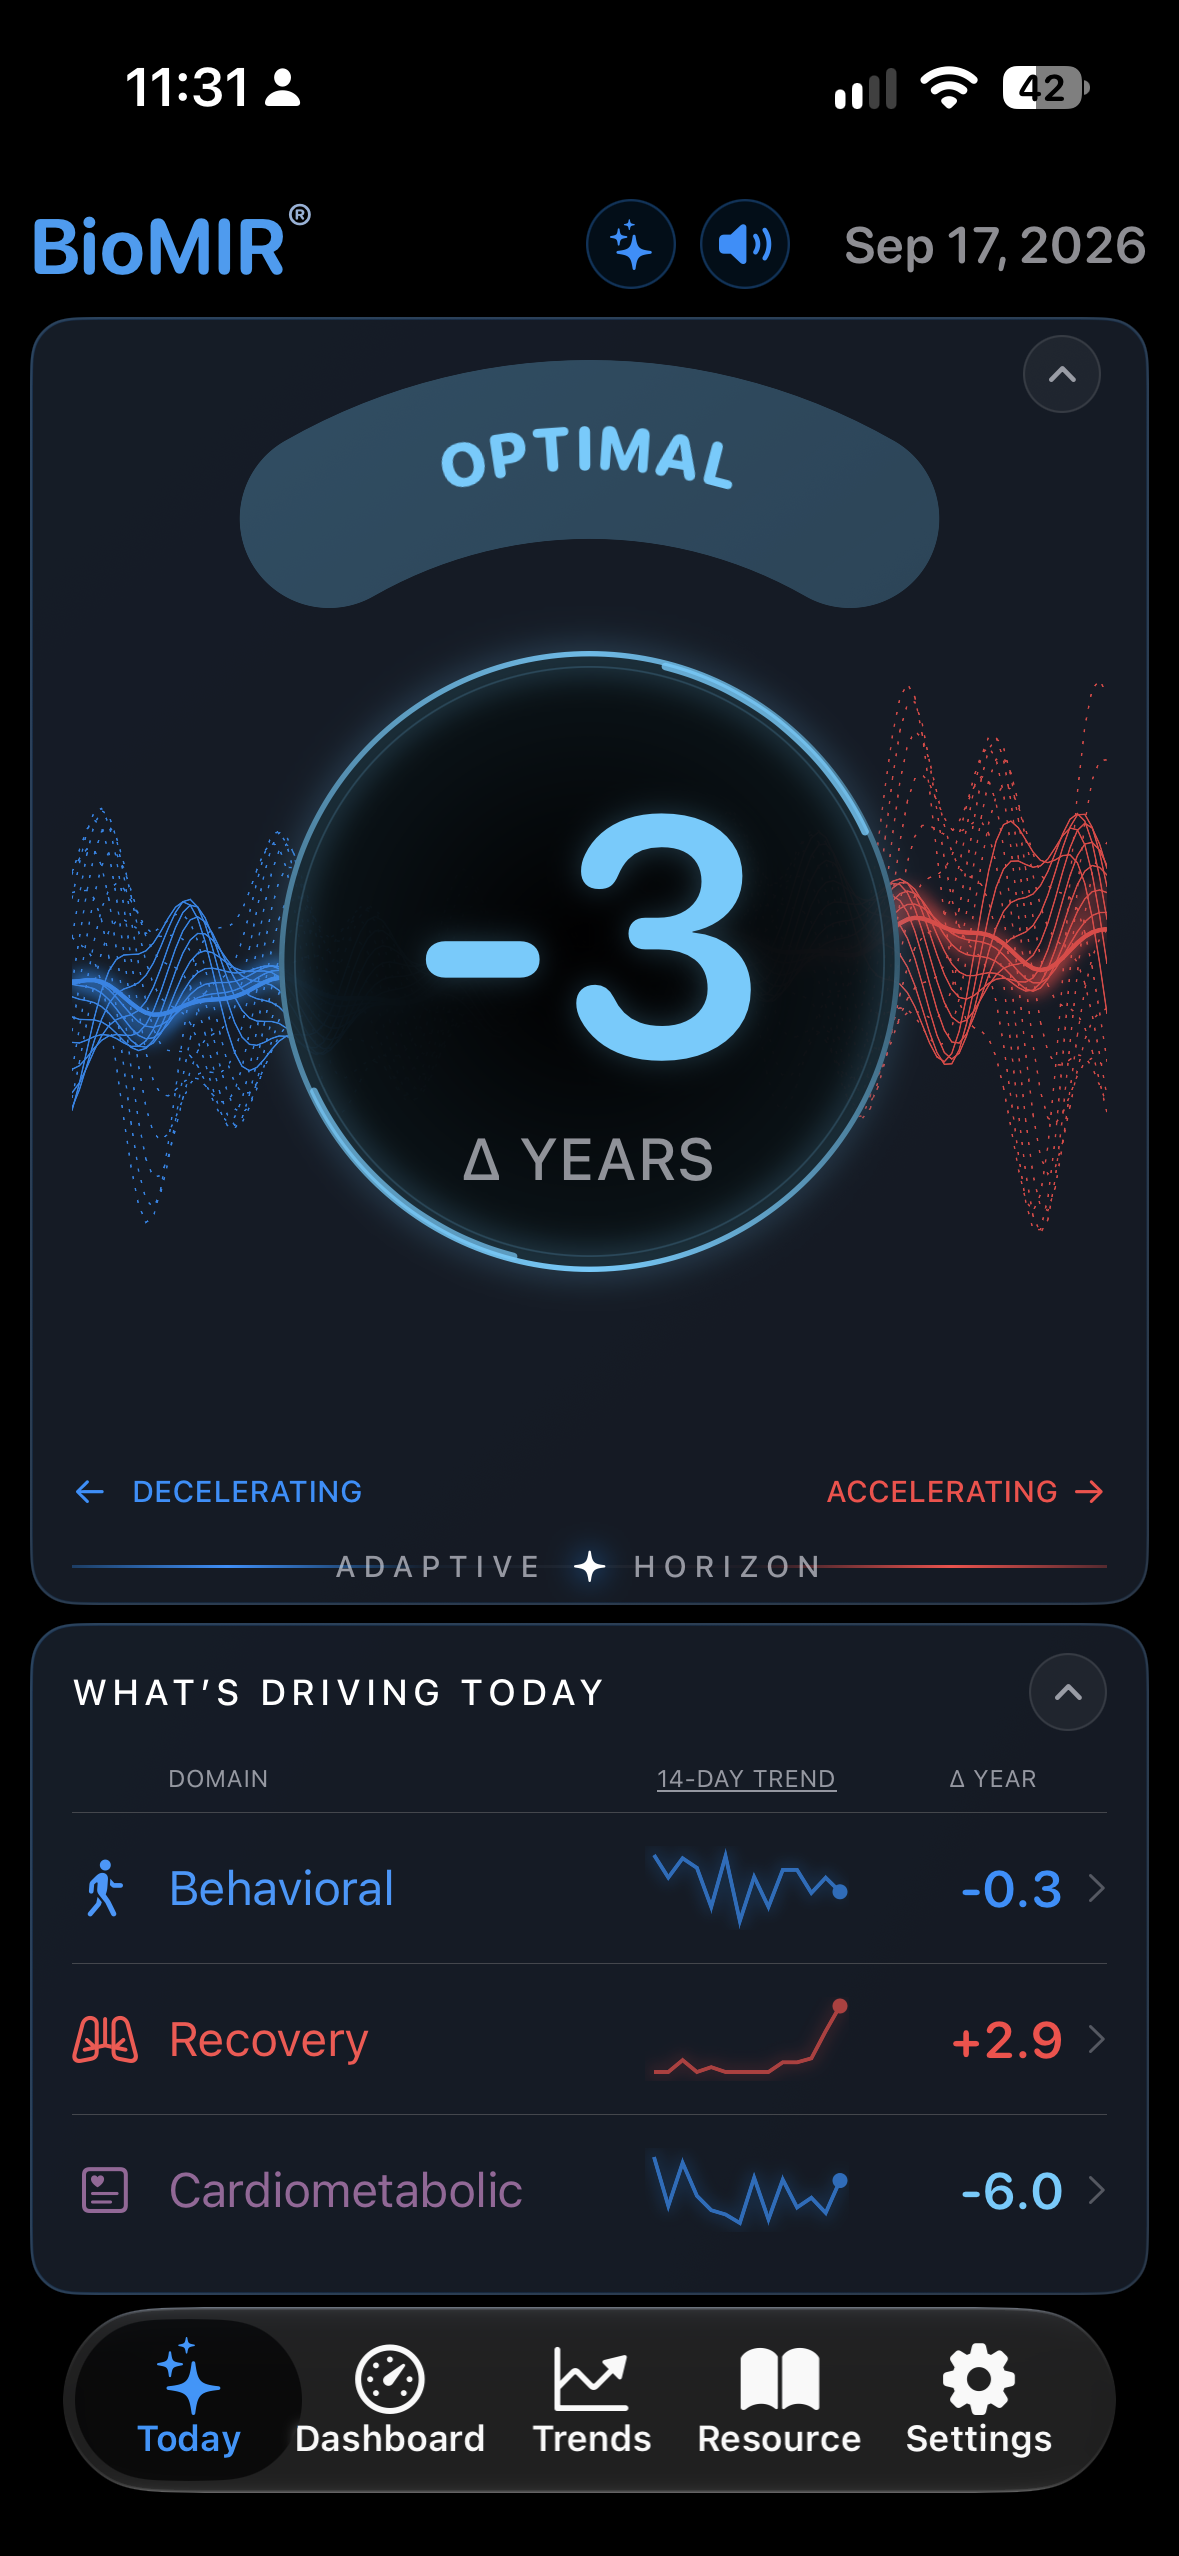
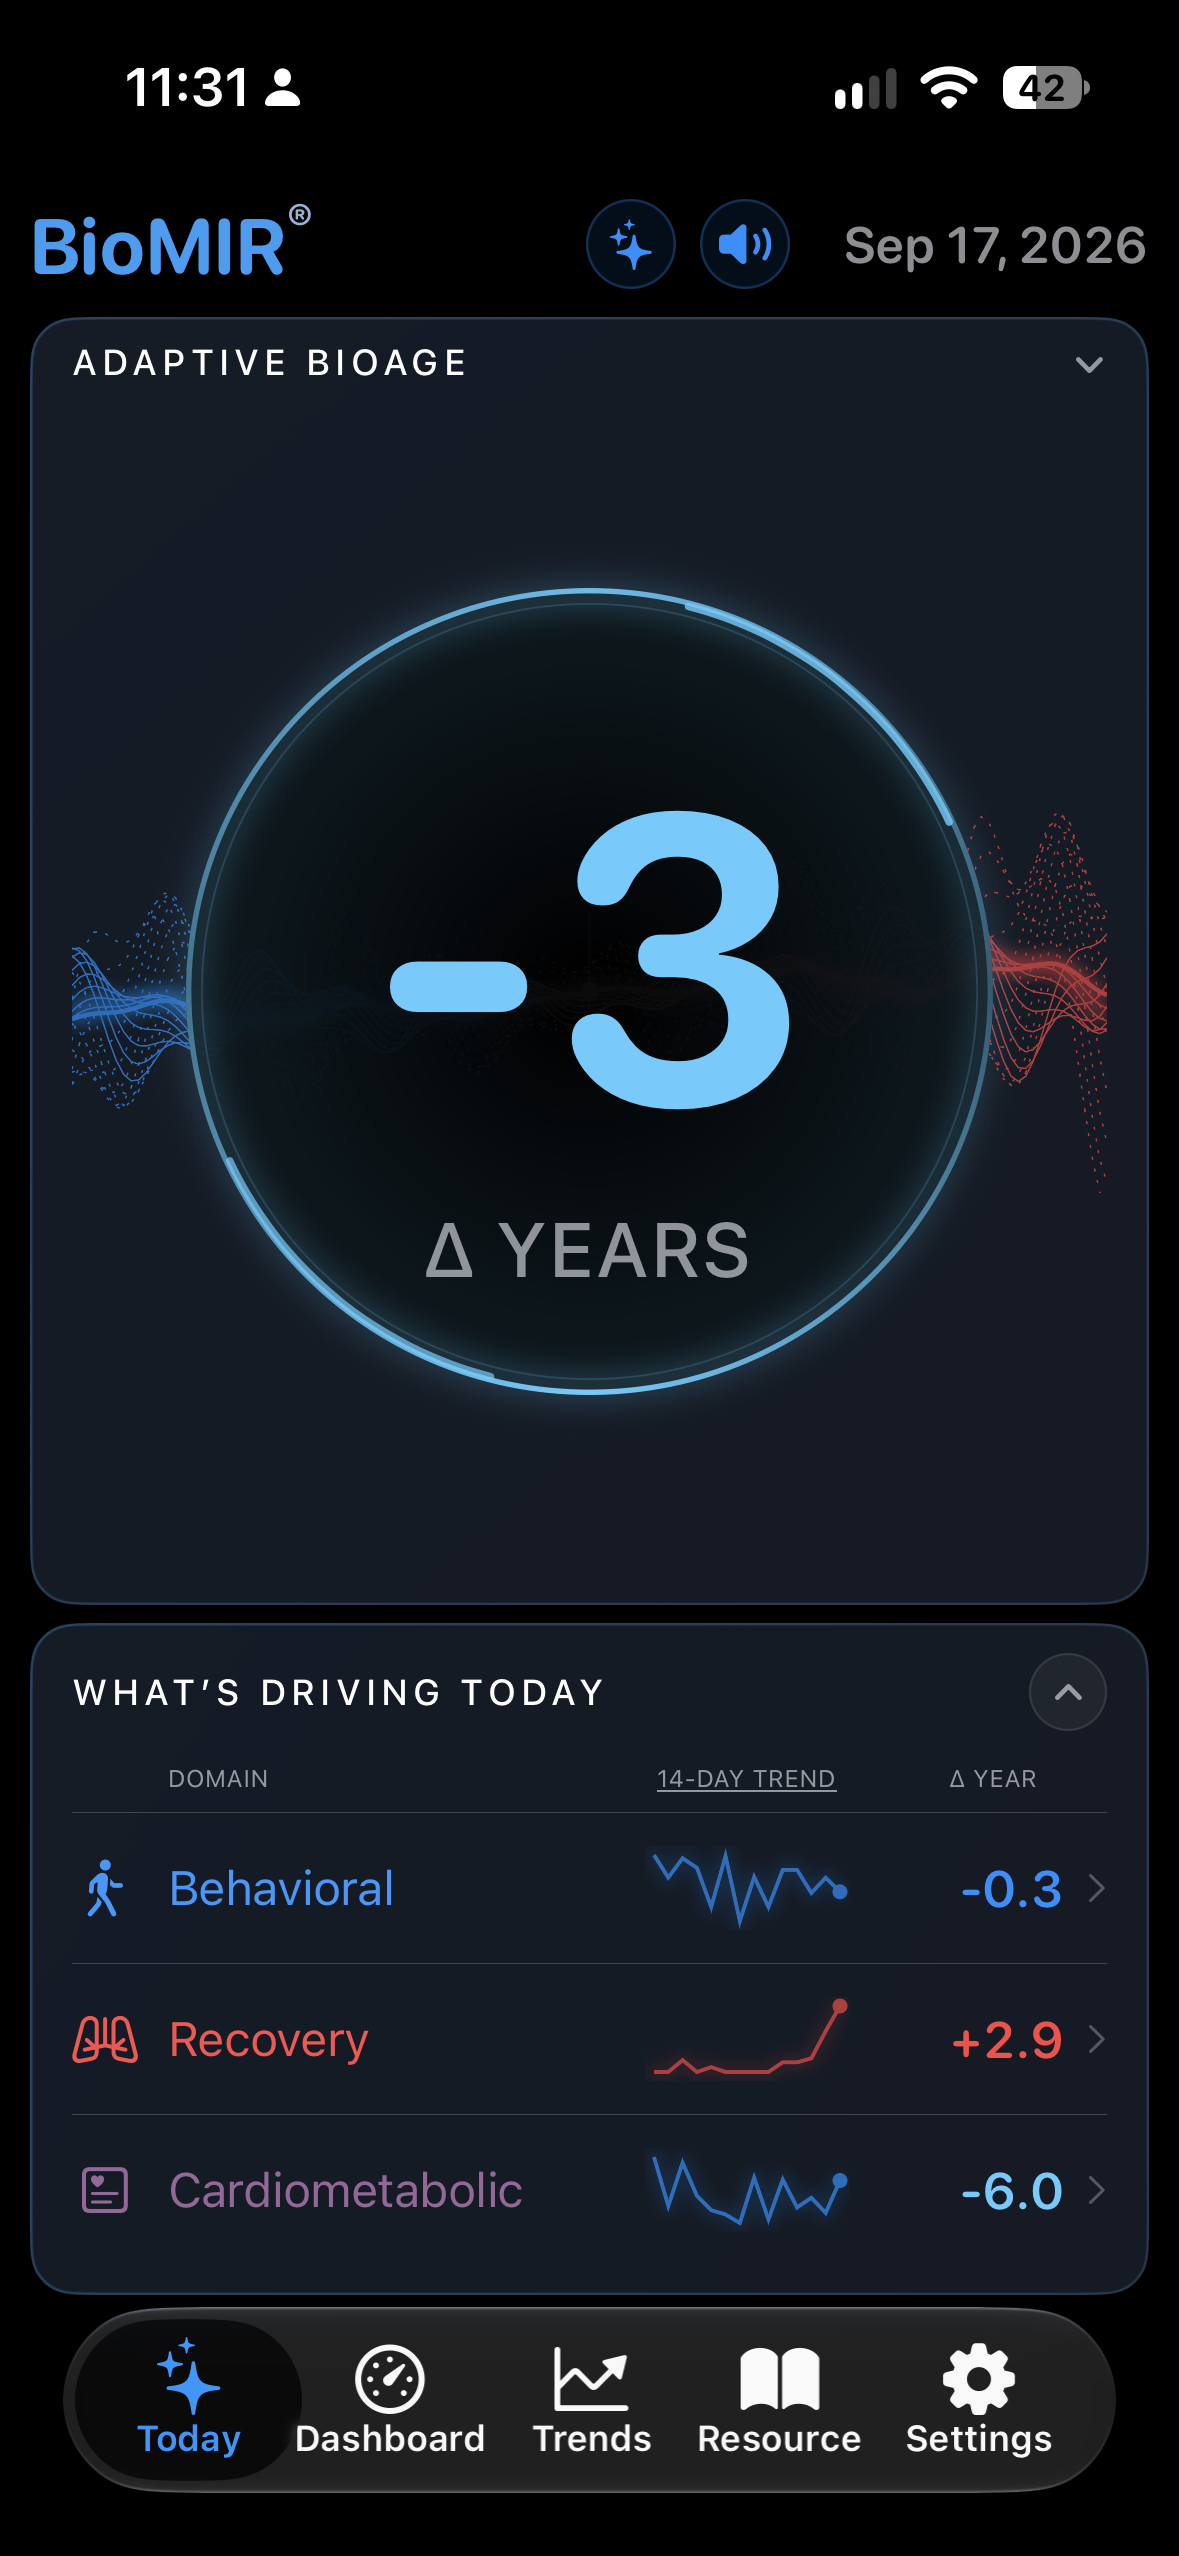
    An age-referenced model output brings Behavioral Adaptation, Recovery, and Cardiometabolic contributions into one view. Δ-years expresses the difference from chronological age.

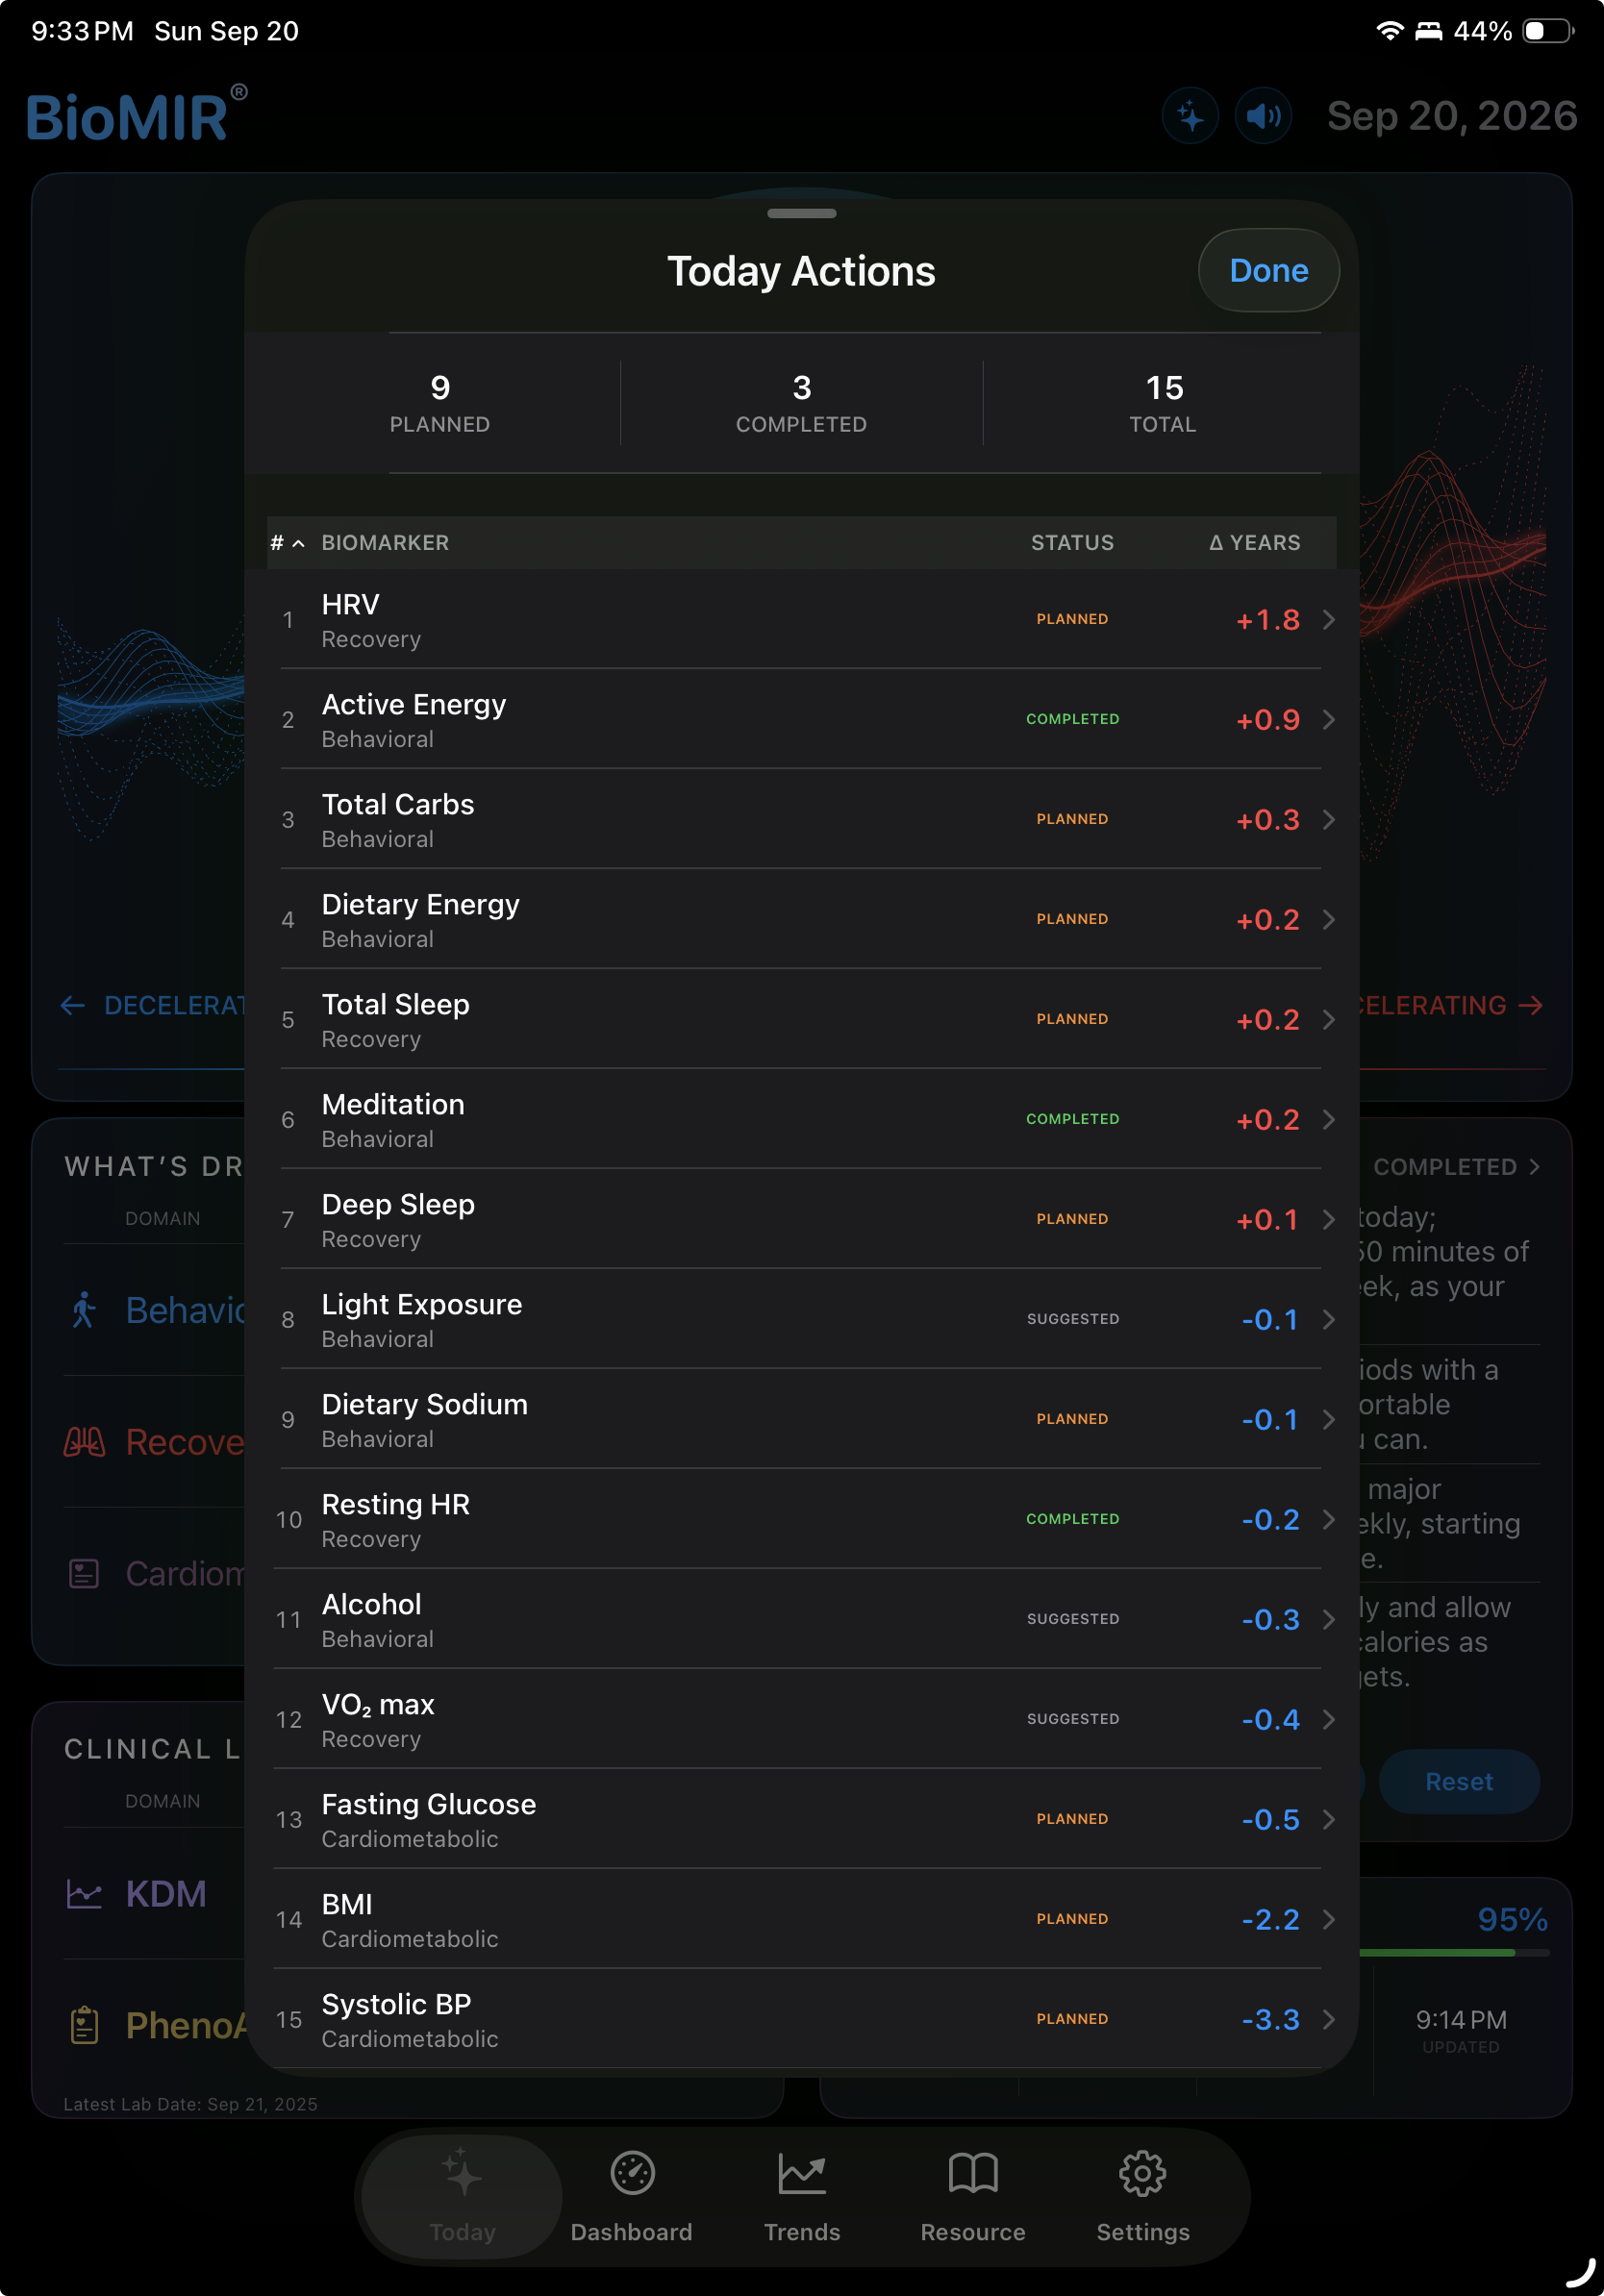
  • Actions with a visible status

    Inspect a contributing biomarker and its prioritized recommendations. Move an action through Suggested, Planned, and Completed to keep track of what you choose to try.

  • A personal spoken briefing

    Listen to an update based on your current snapshot. The briefing is assembled and spoken on your device.

  • Your Today, arranged for you

    On iPhone, configure the Today experience and expand or collapse supported cards. Data Confidence stays visible alongside the results.

Today · iPhone1 / 6
BioMIR Today screenshot 1
Daily overview
BioMIR Today screenshot 2
Daily overview
BioMIR Today screenshot 3
Daily overview
BioMIR Today screenshot 4
Daily overview
BioMIR Today screenshot 5
Daily overview
BioMIR Today screenshot 6
Daily overview
Swipe to explore · Tap to enlarge

02 / Investigate

A number is
the beginning.

Dashboard reveals what is behind the estimate. Trends shows whether the pattern persists. Together, they connect a summary to its measurements, model context, data quality, and change over time.

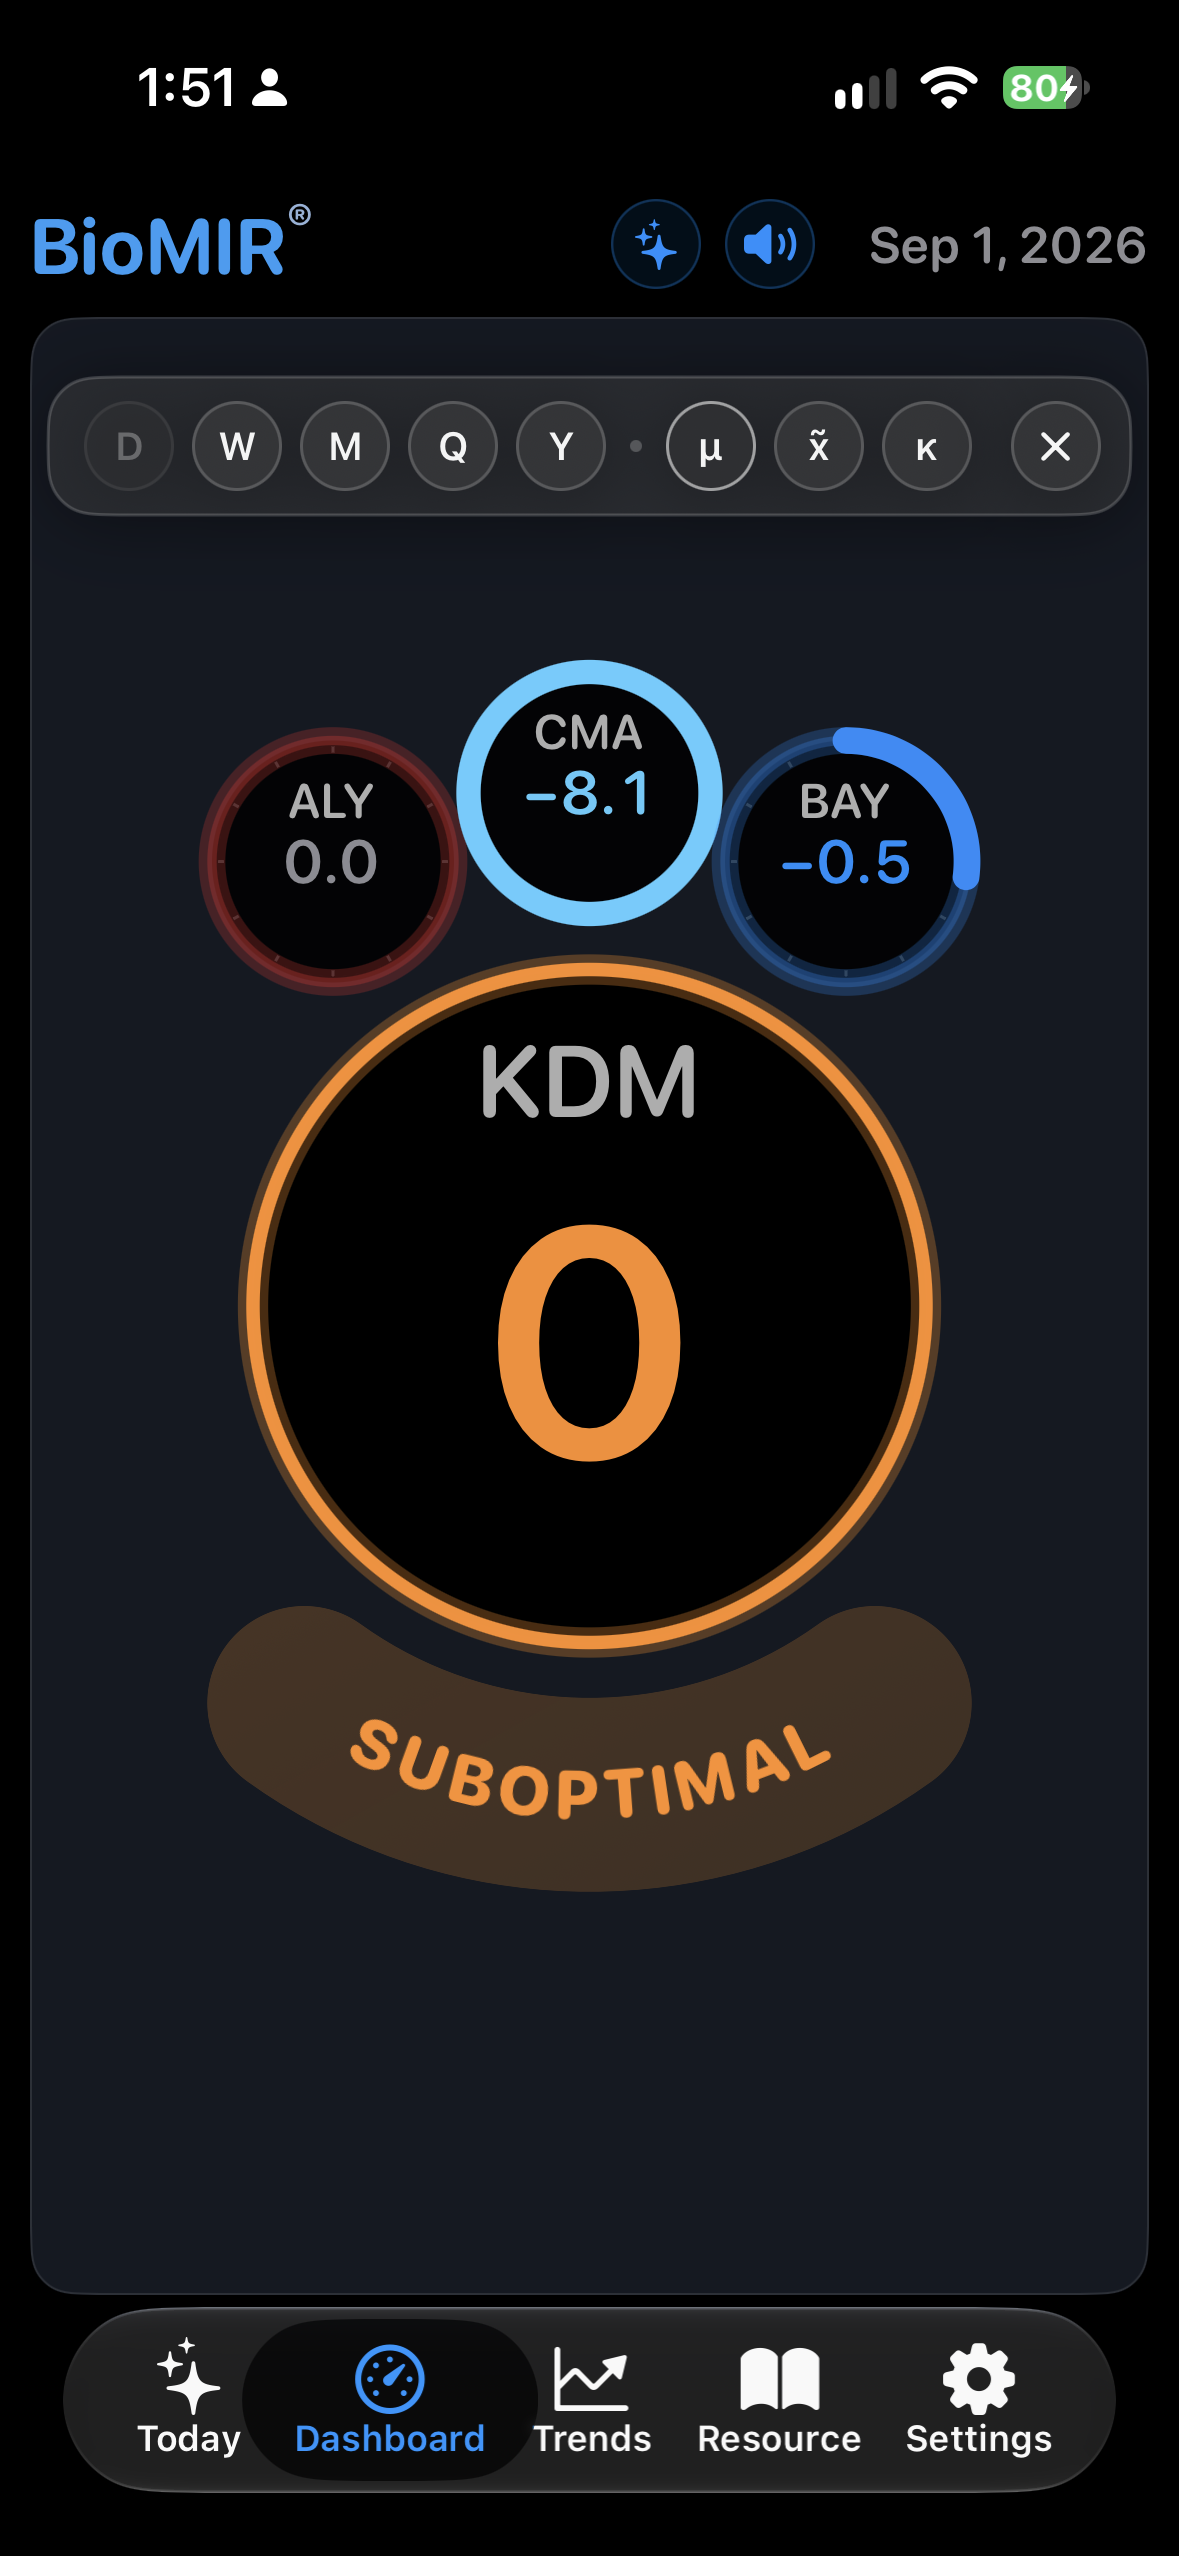
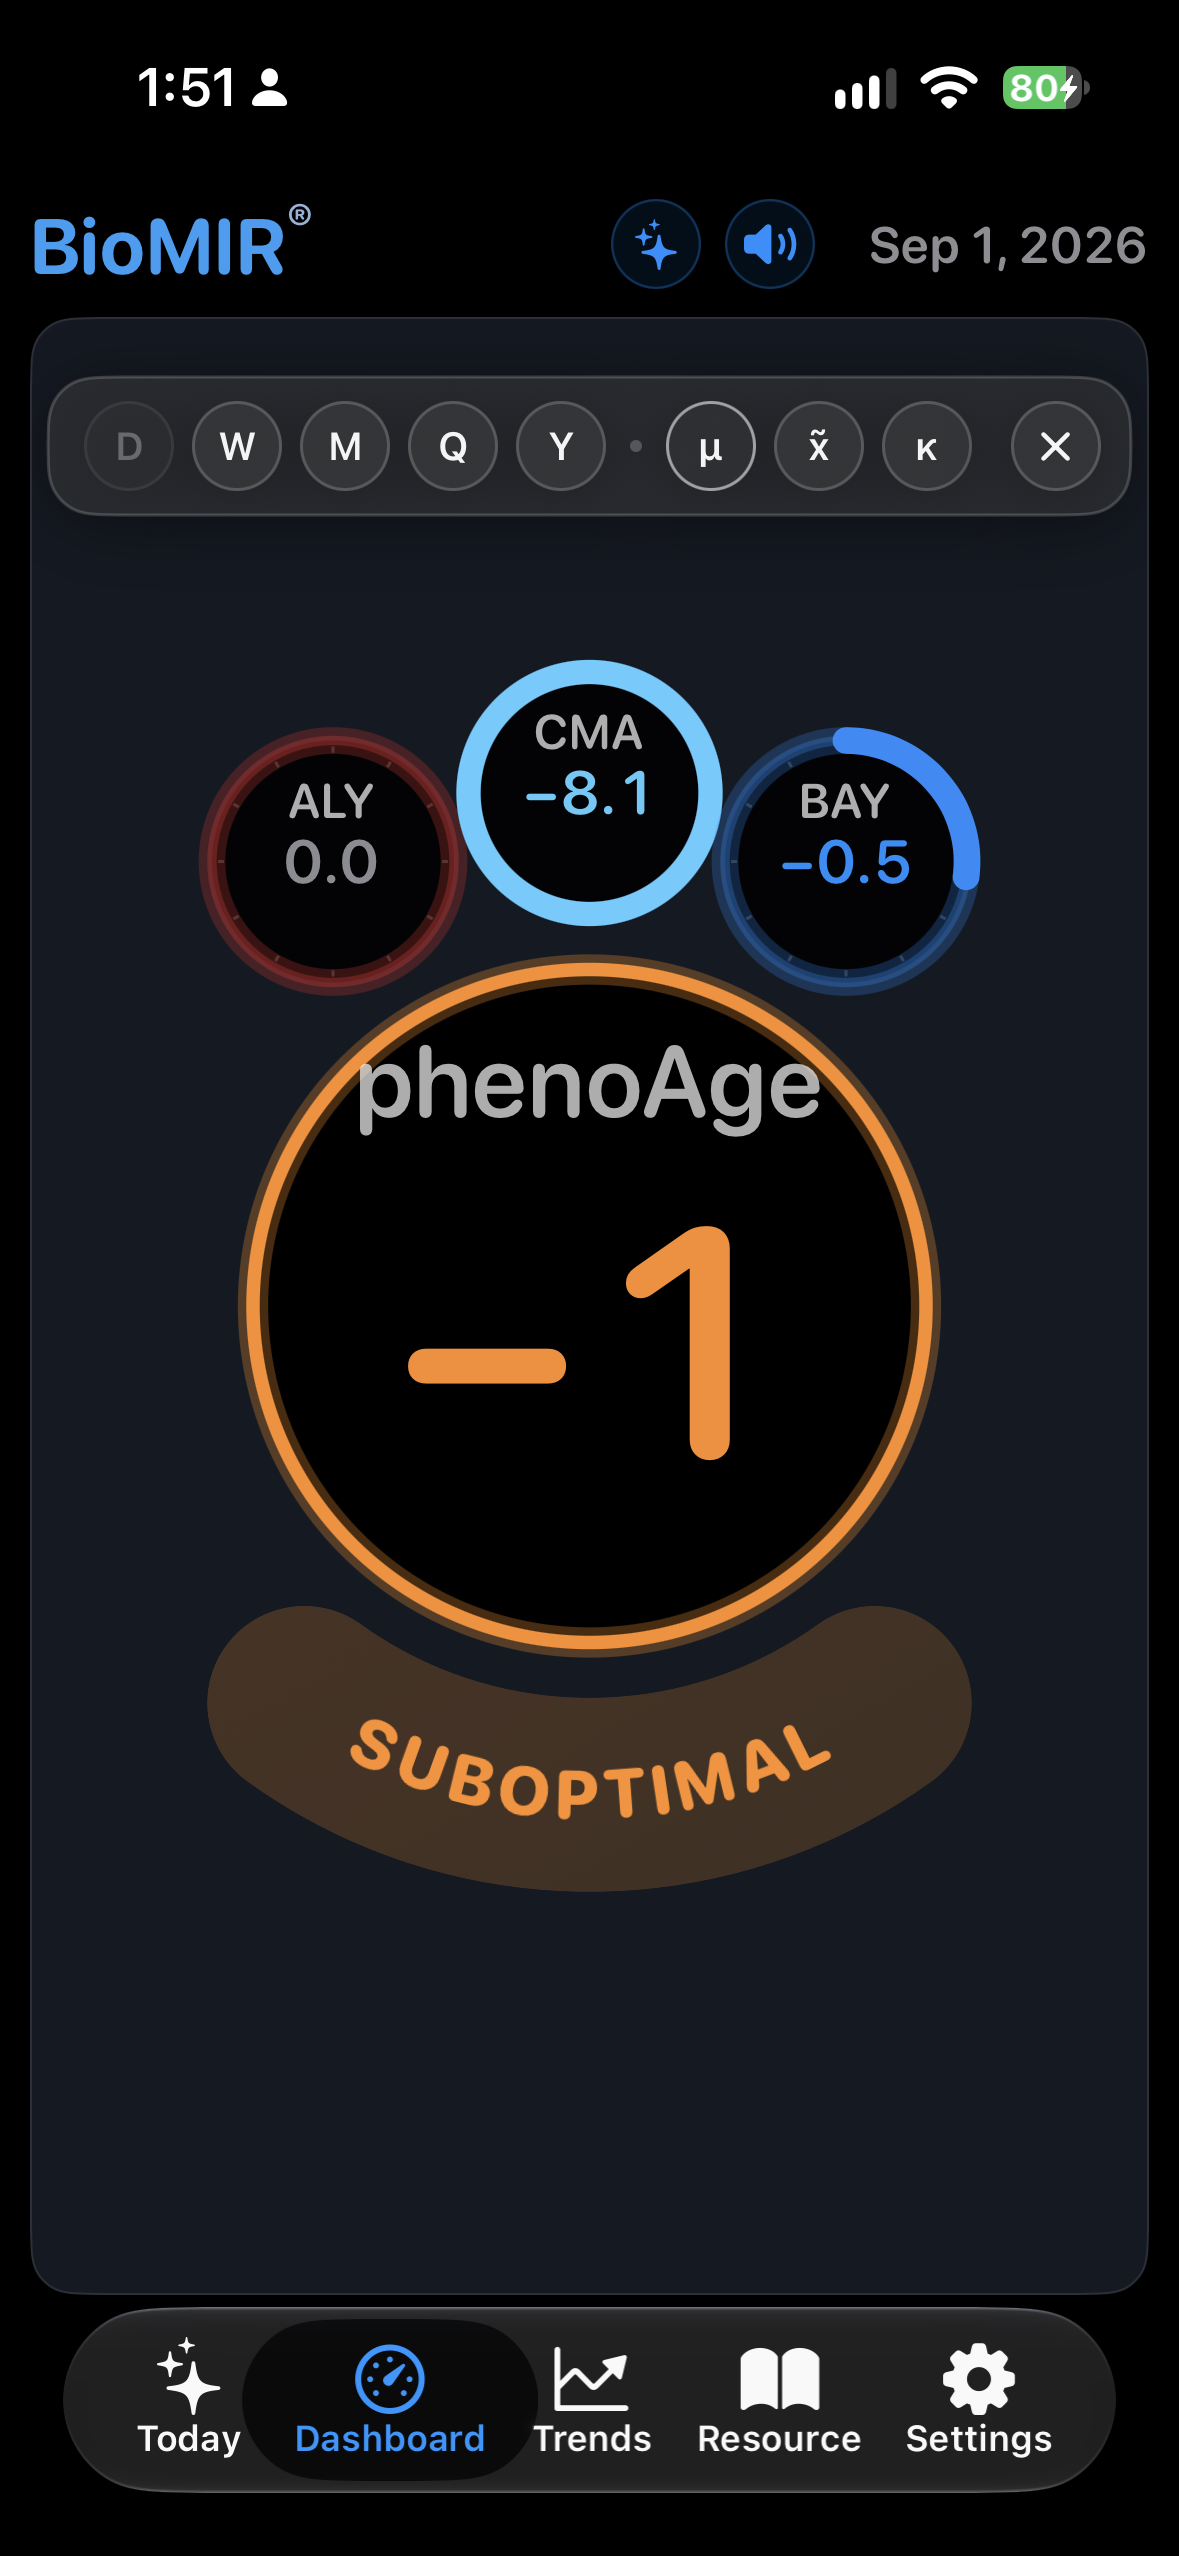
Dashboard: trace the contributions

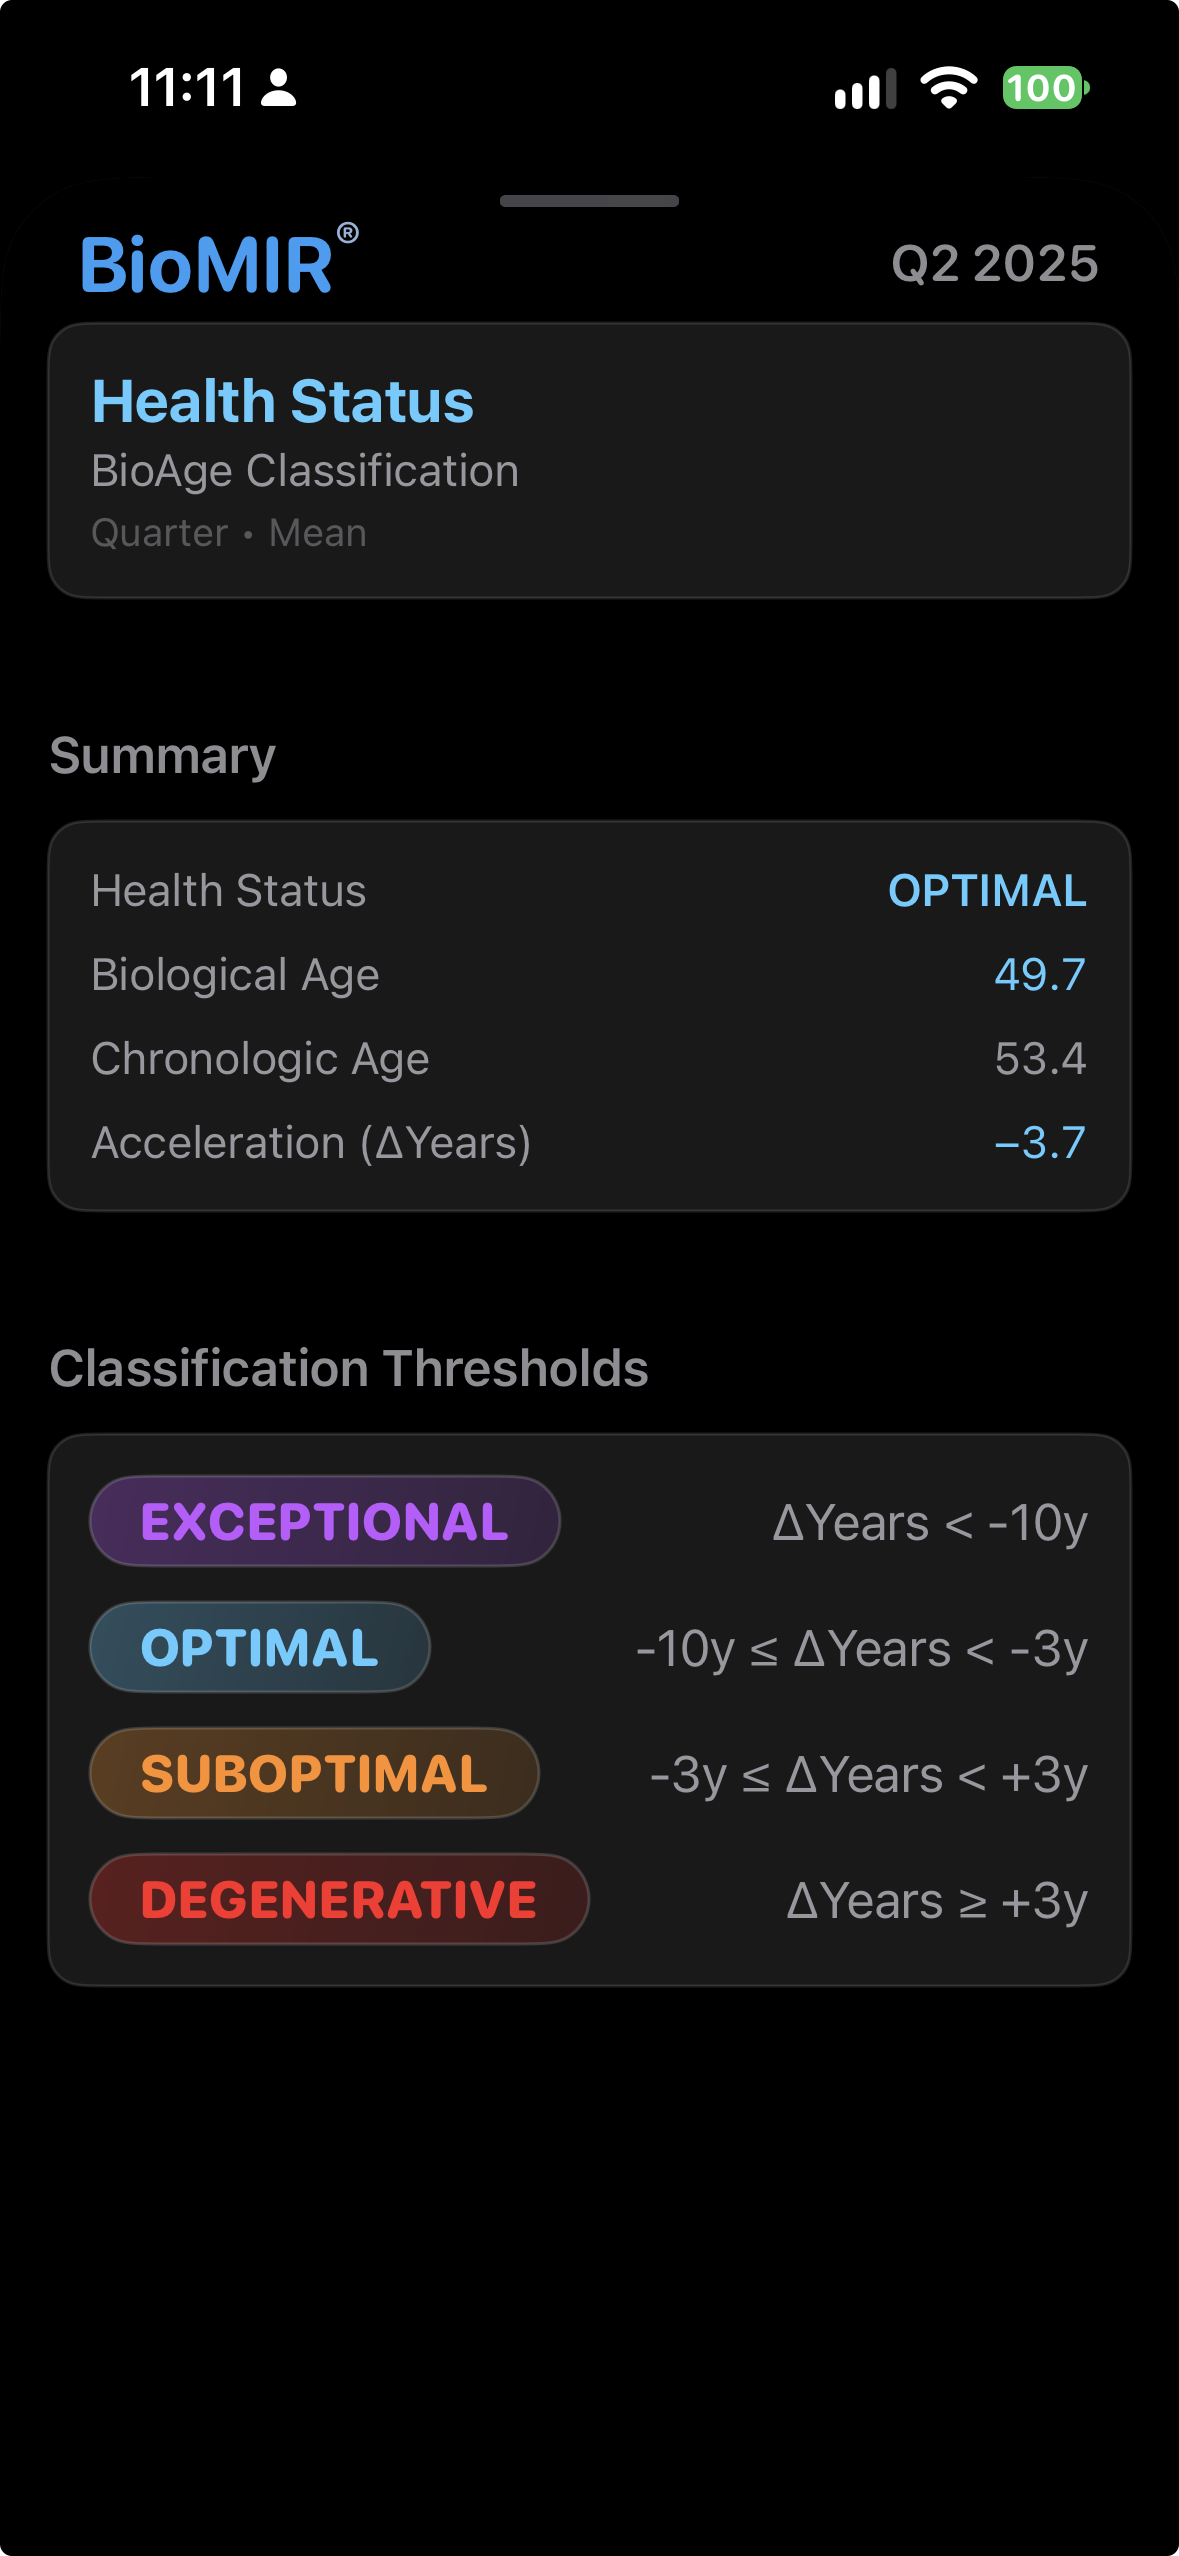
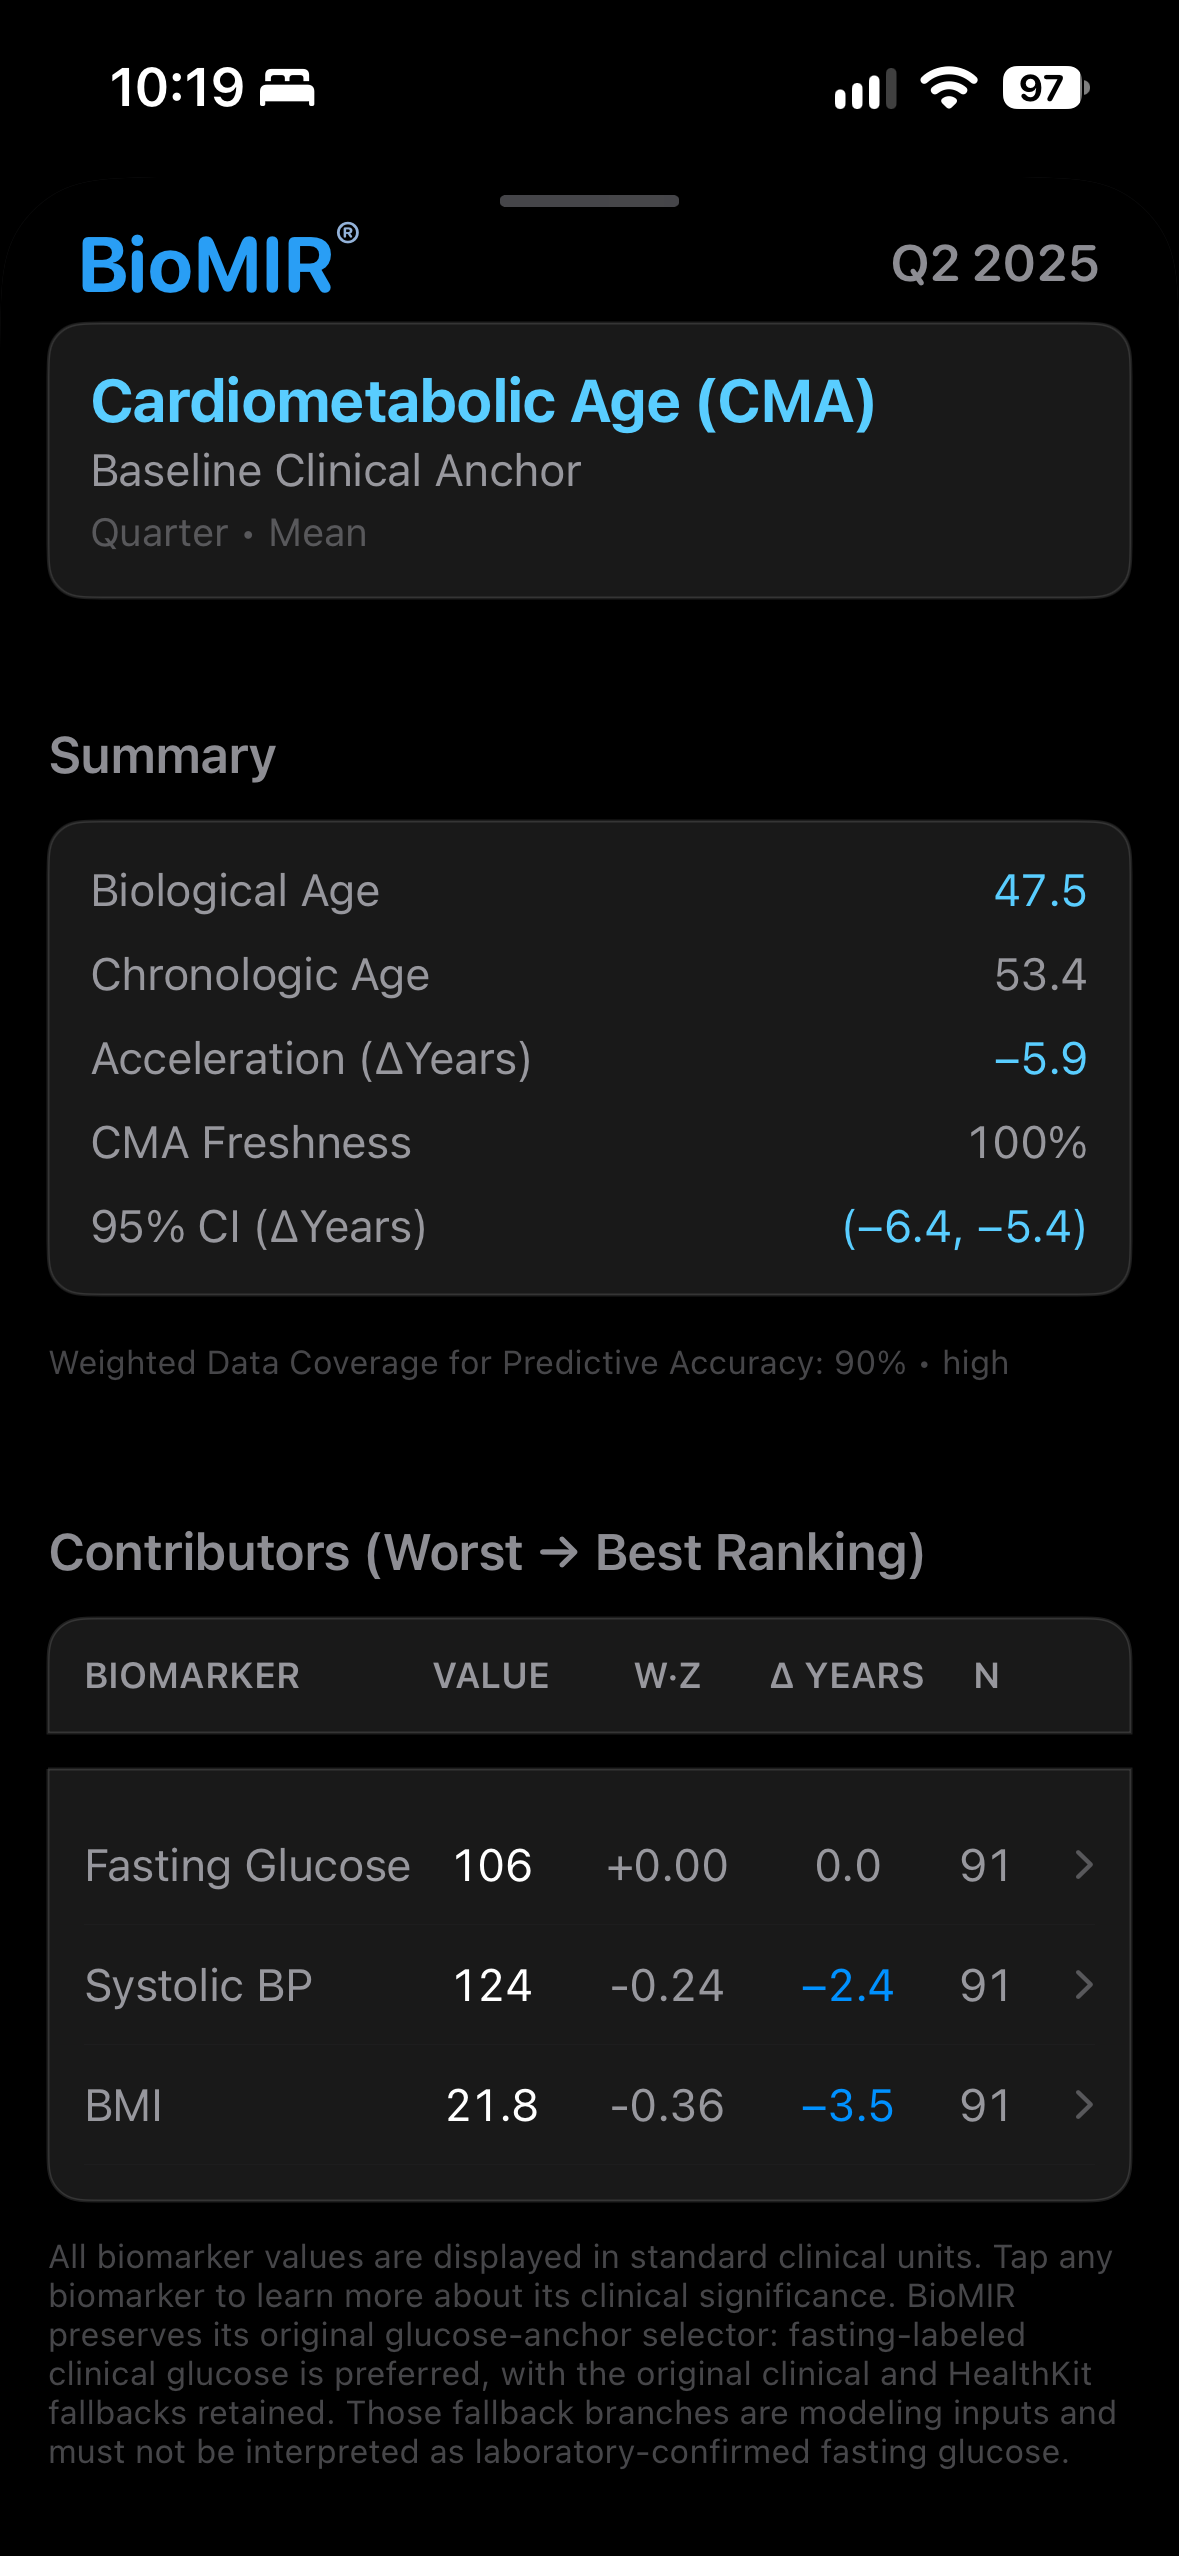
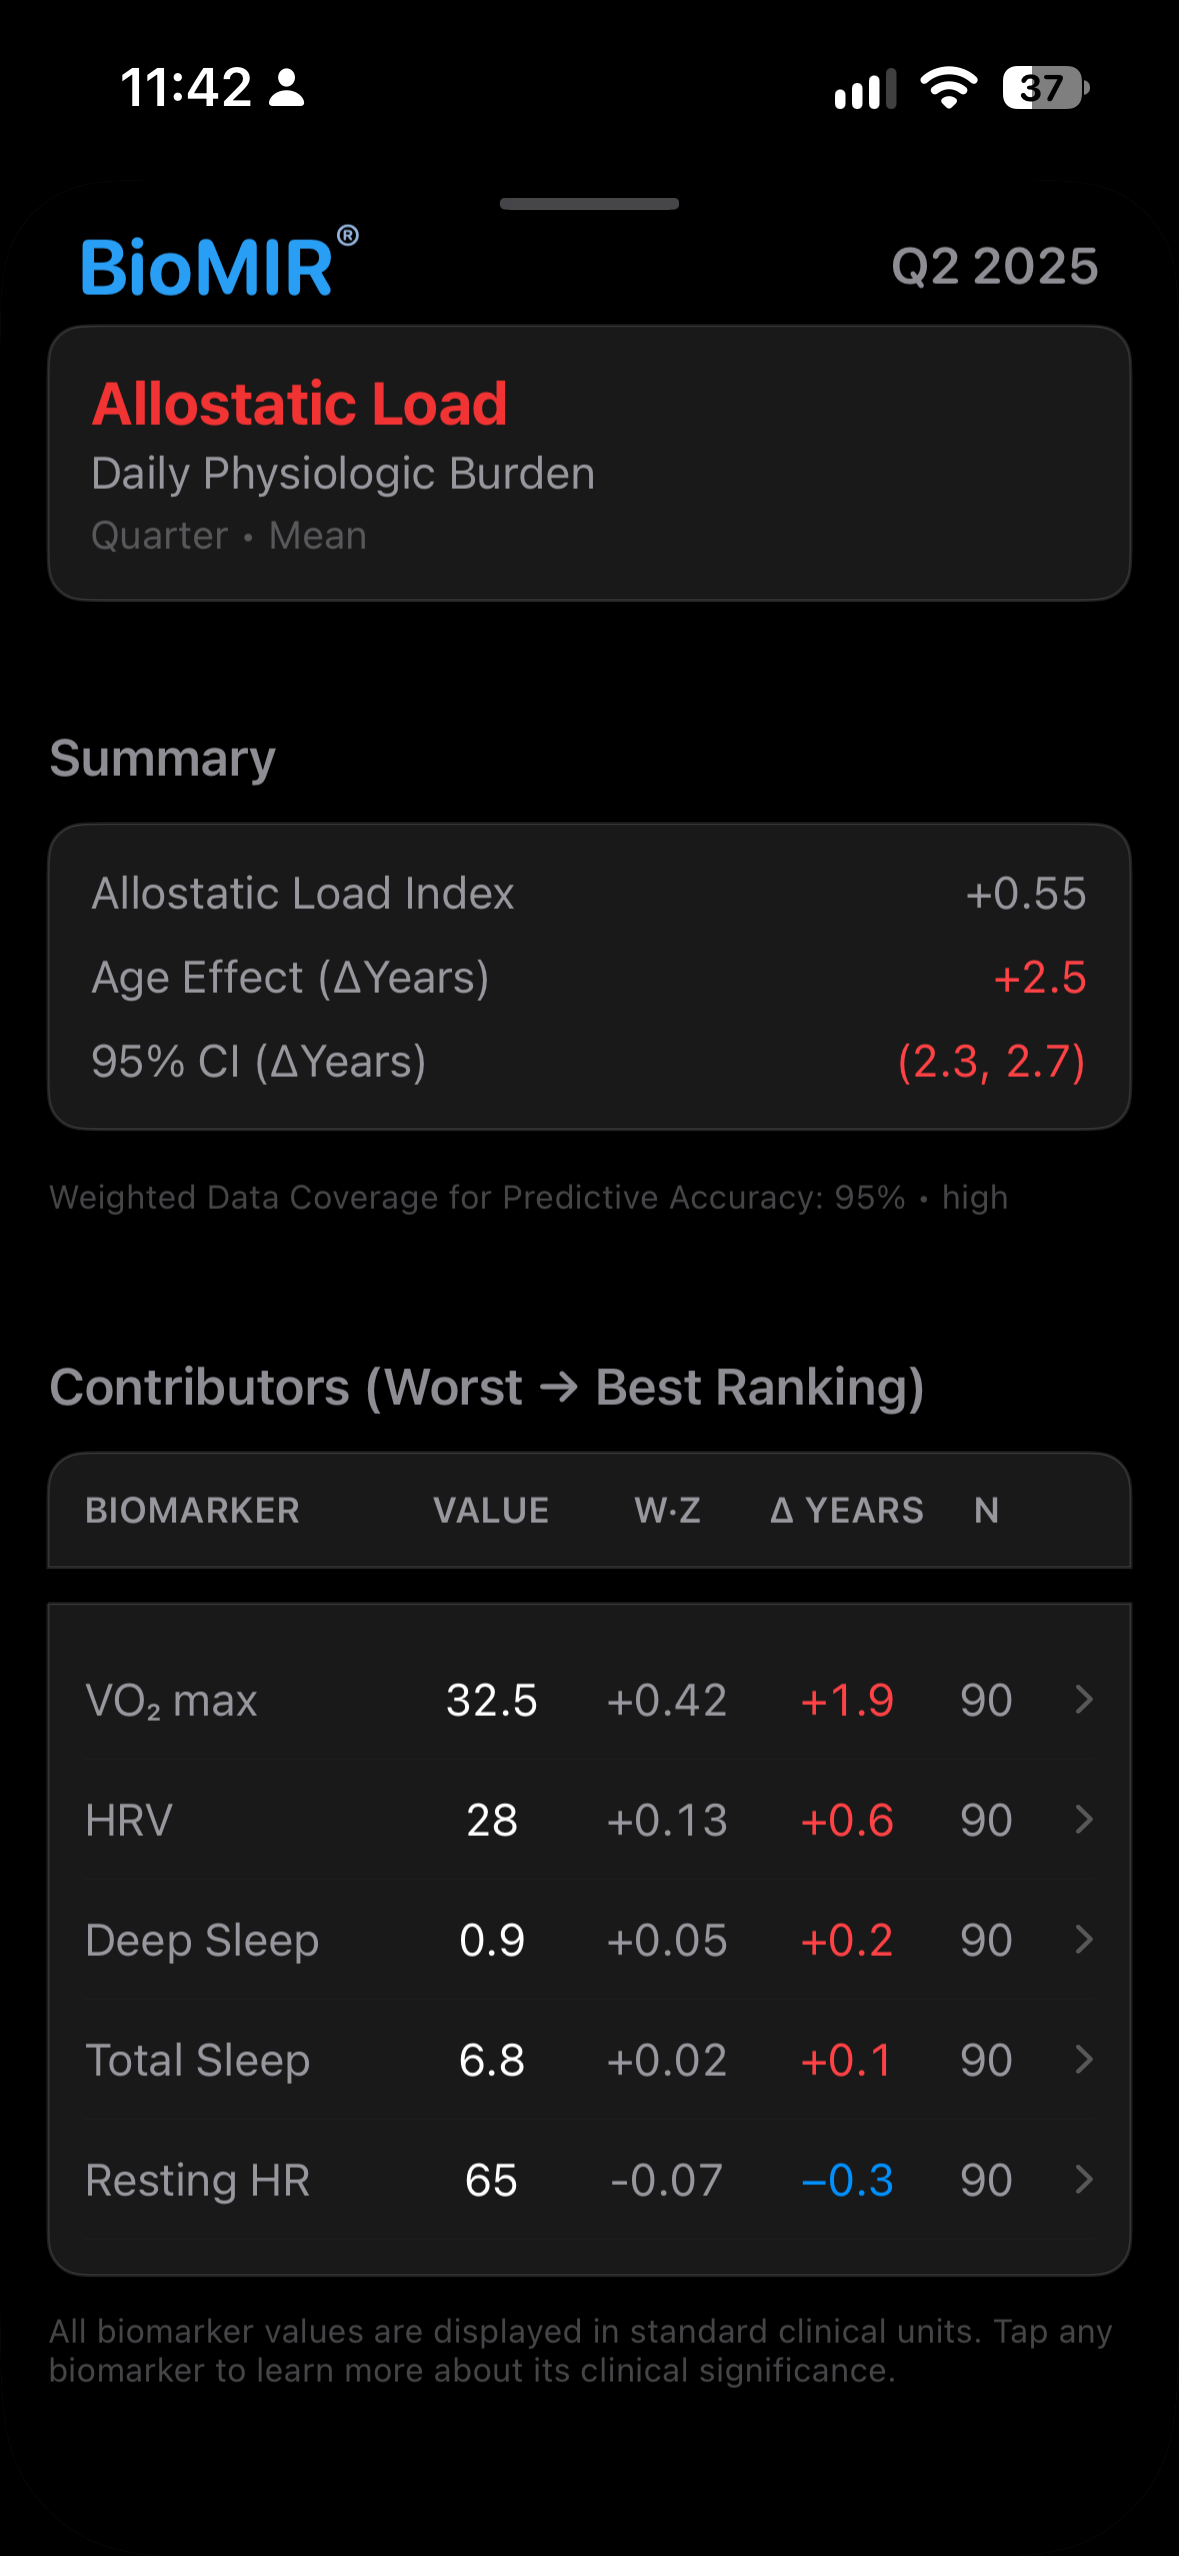
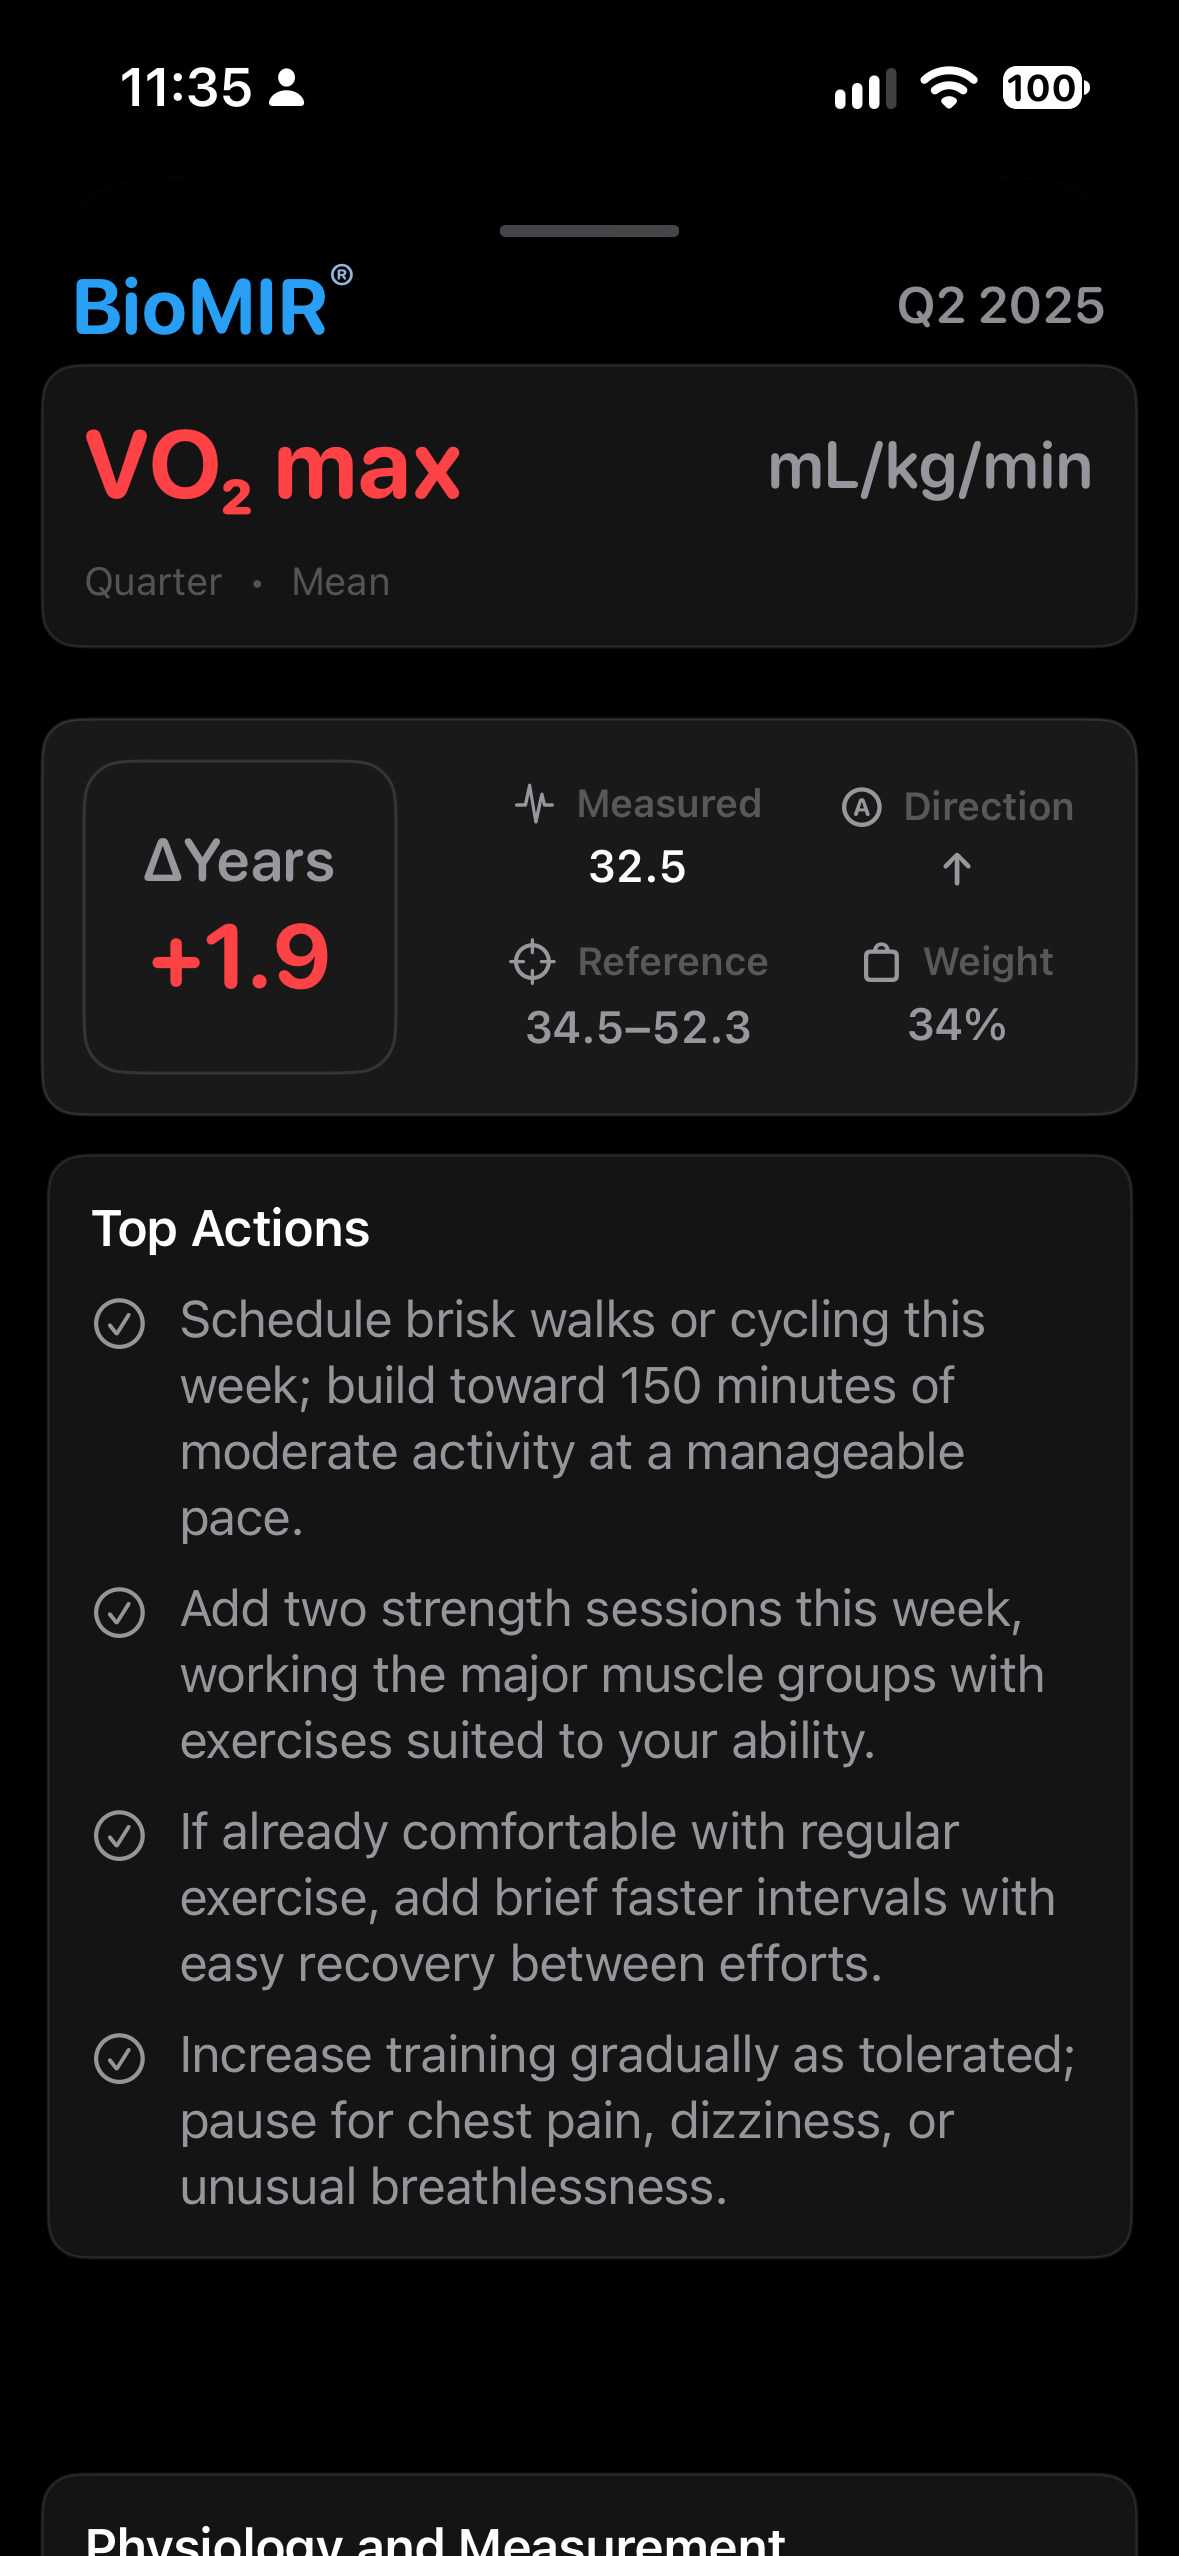
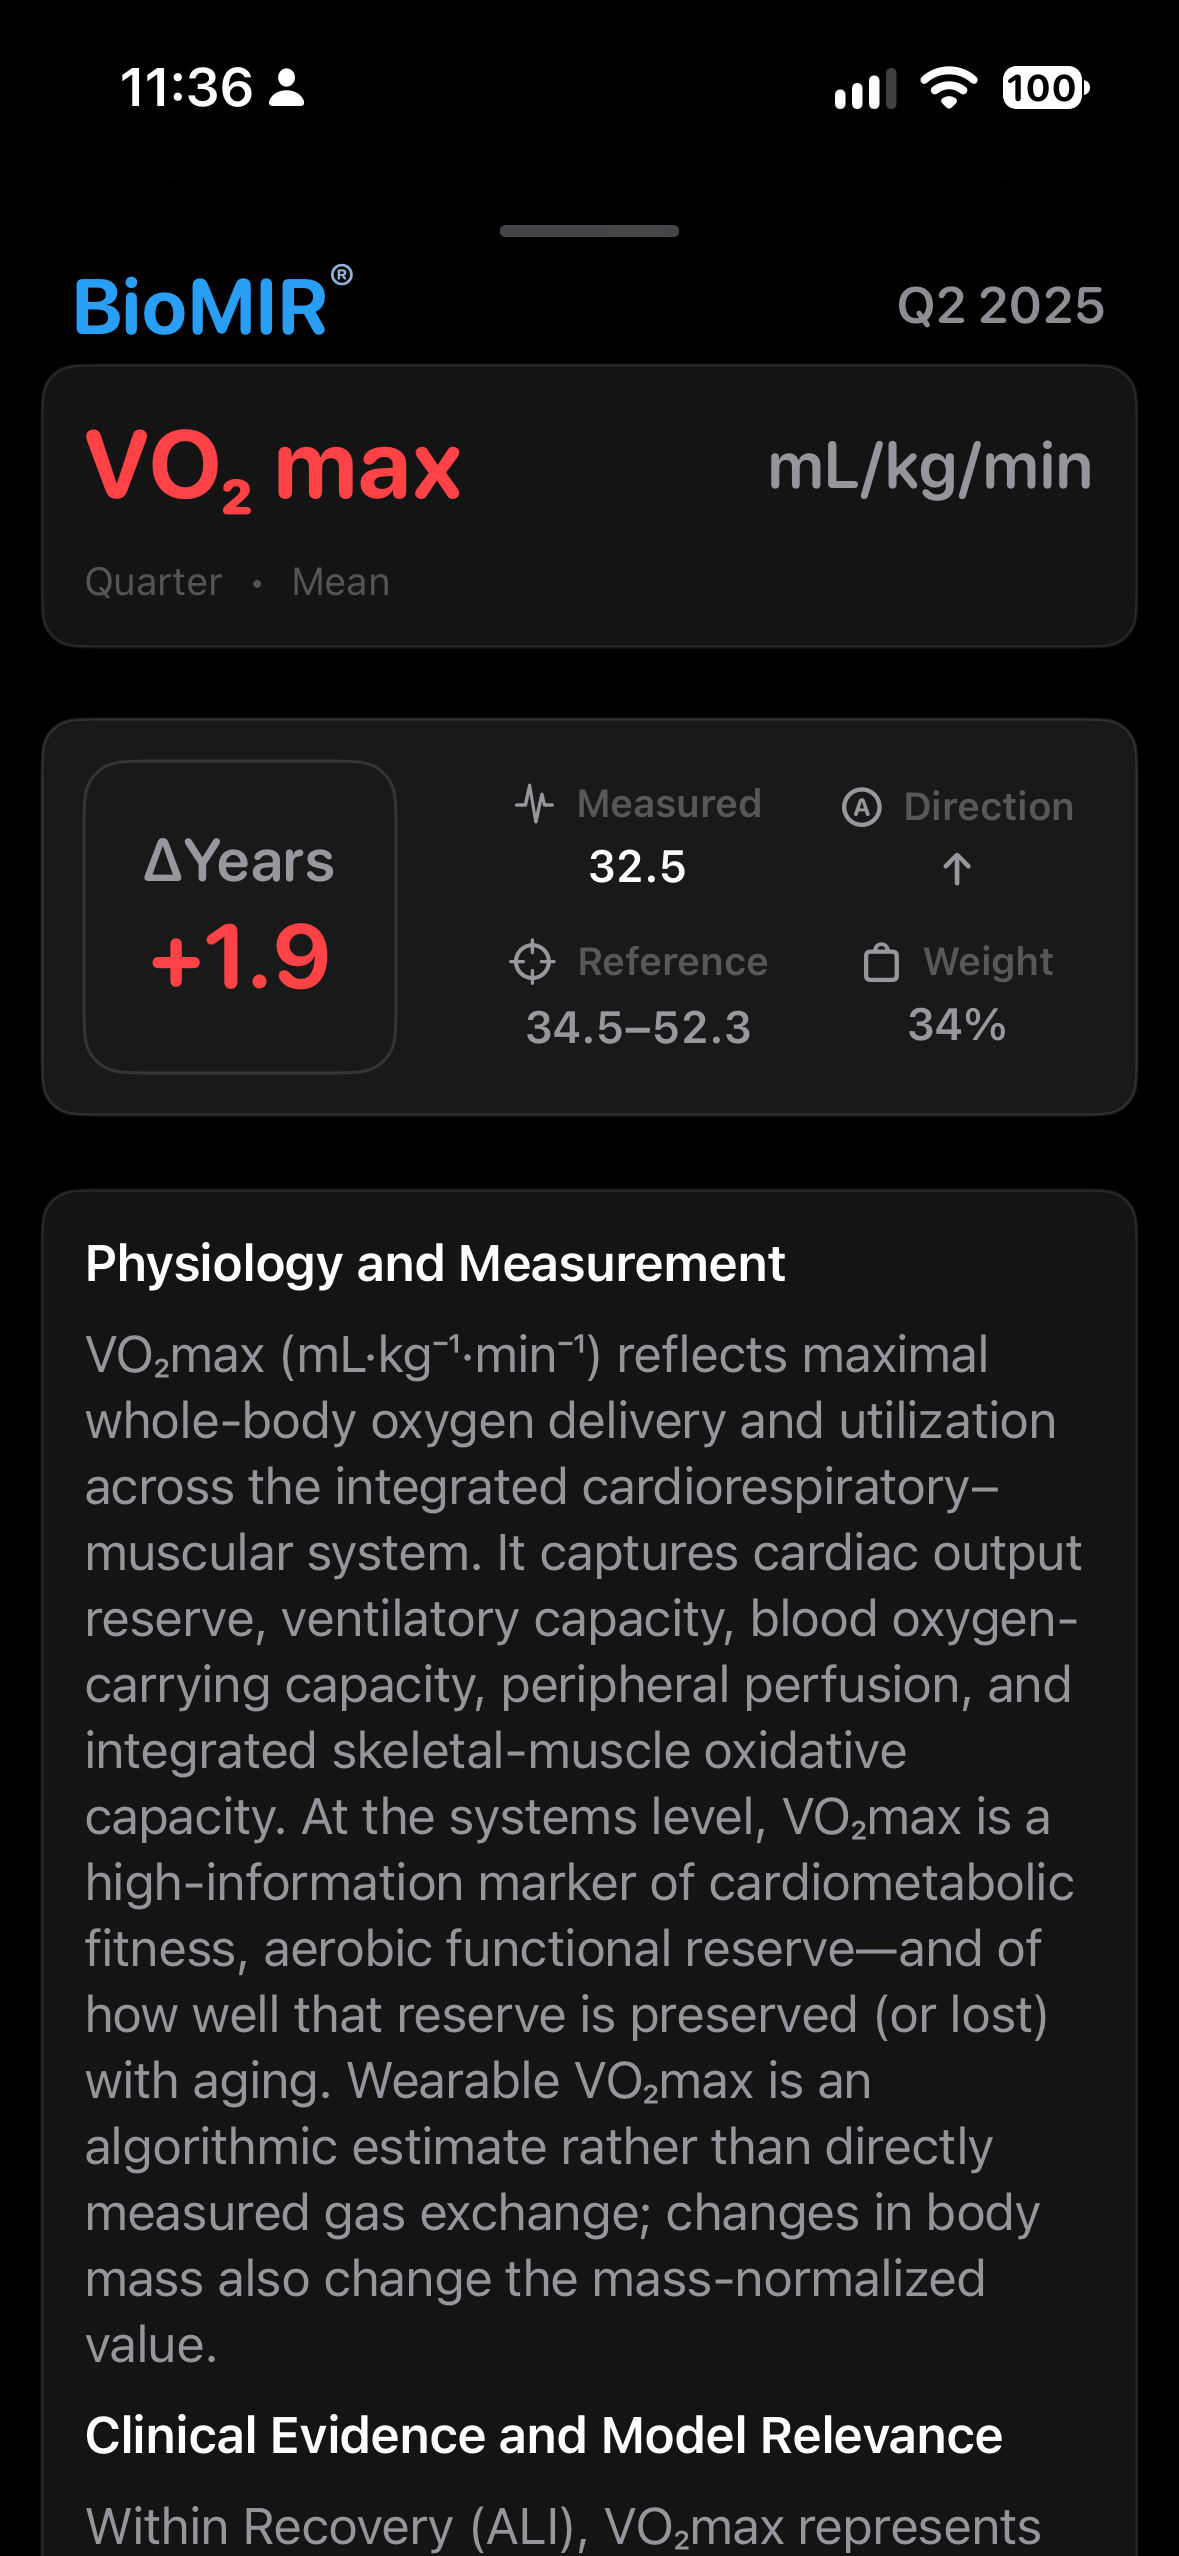
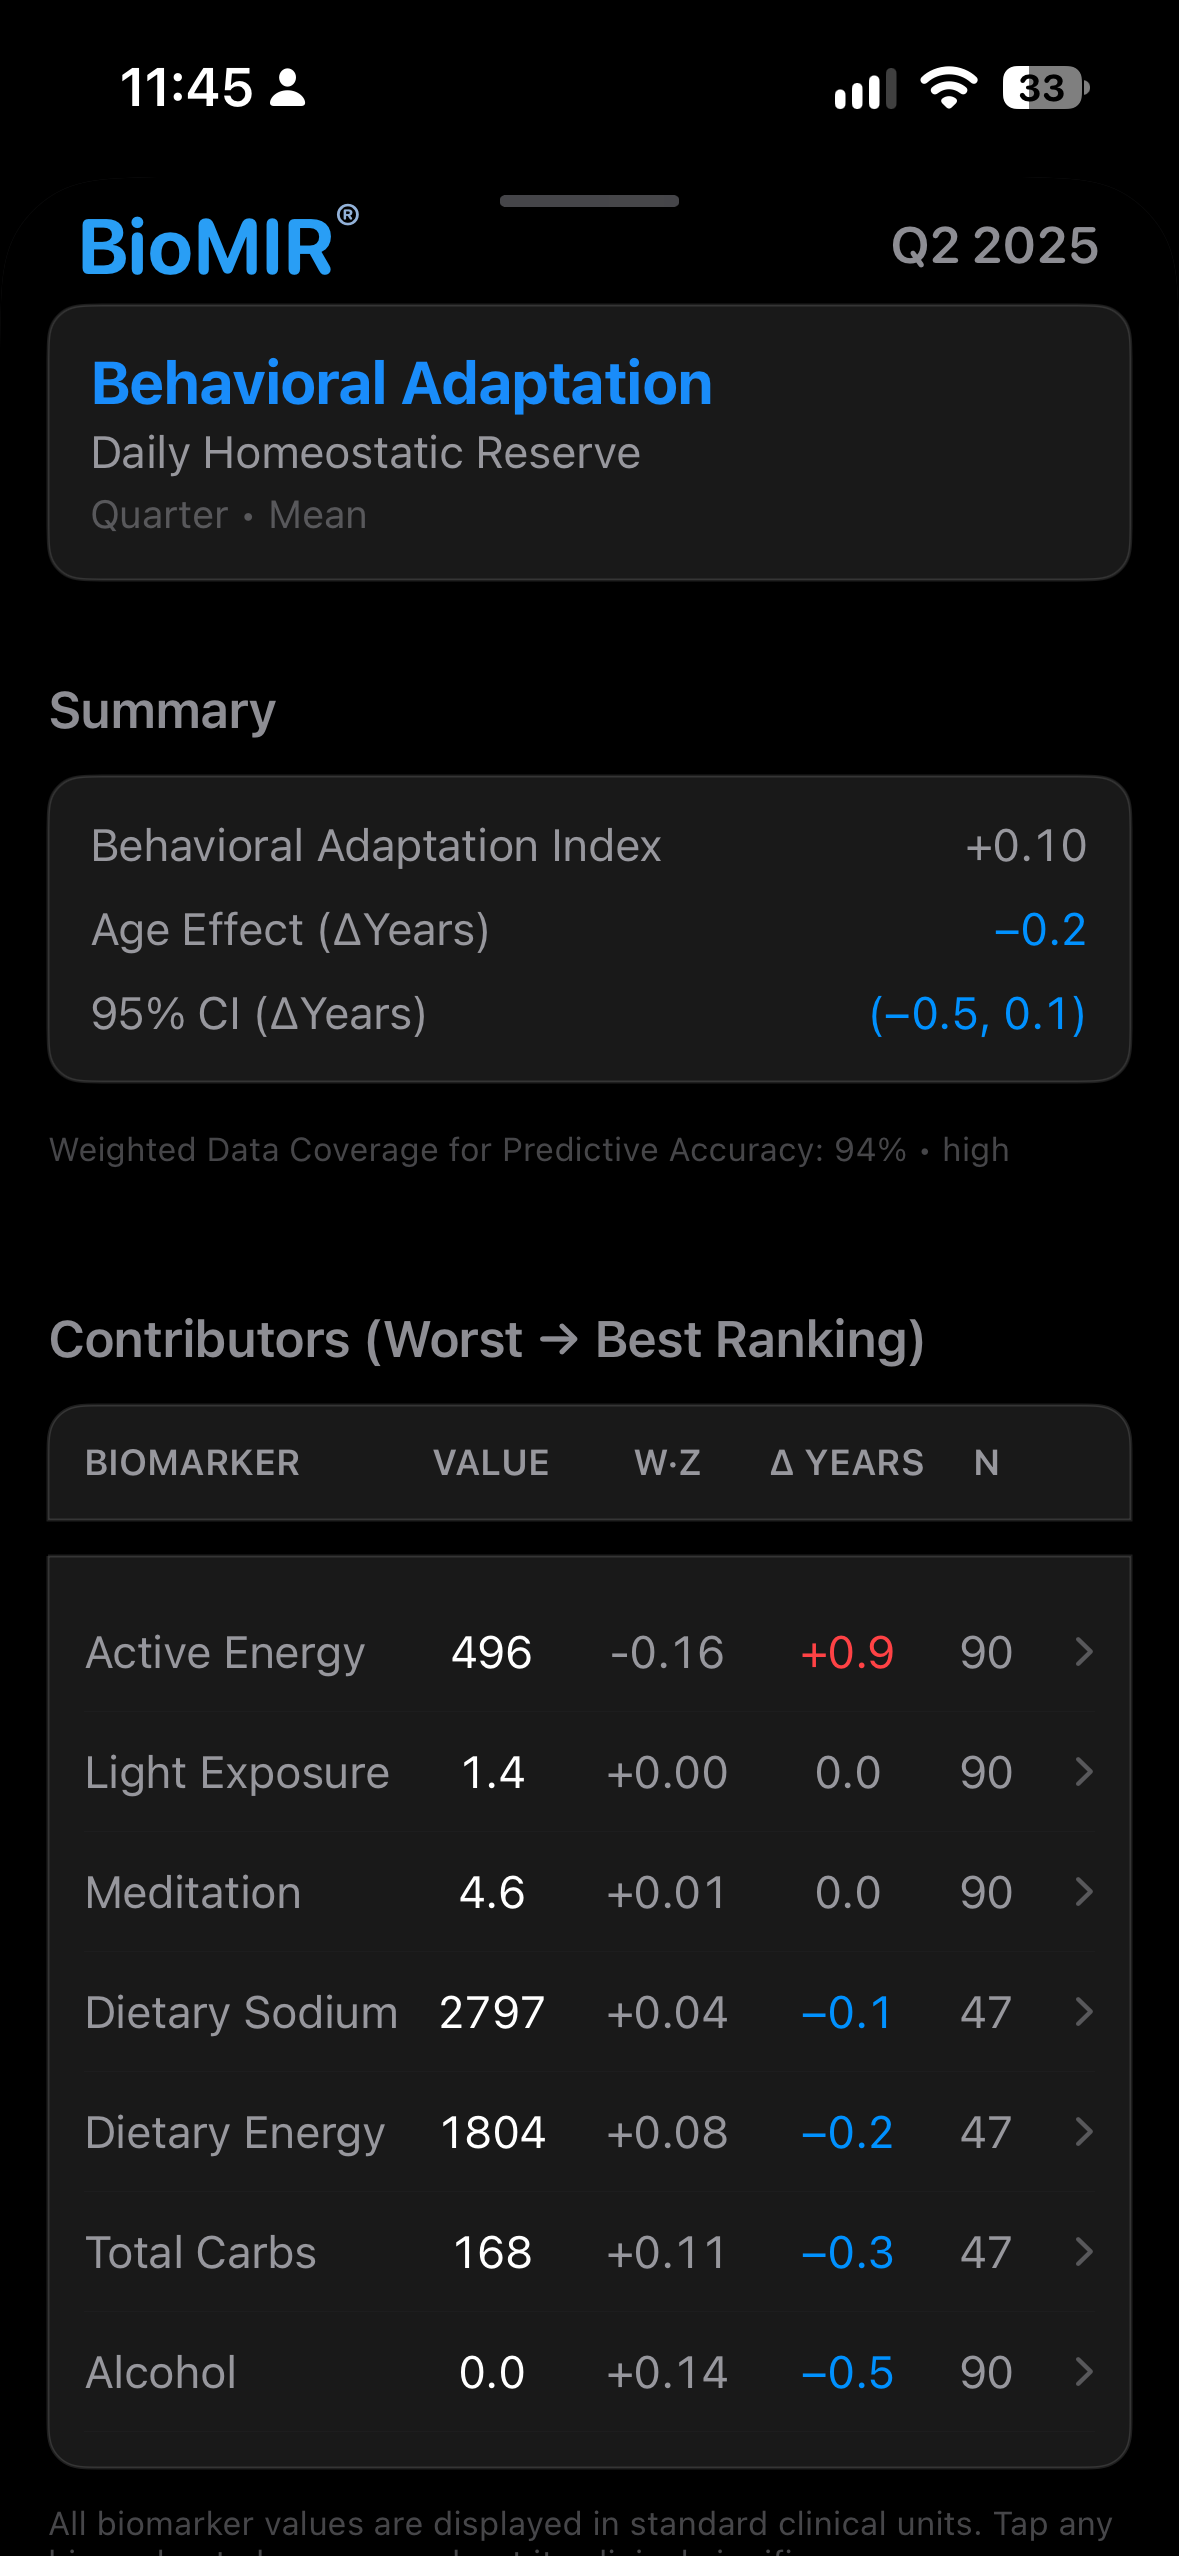
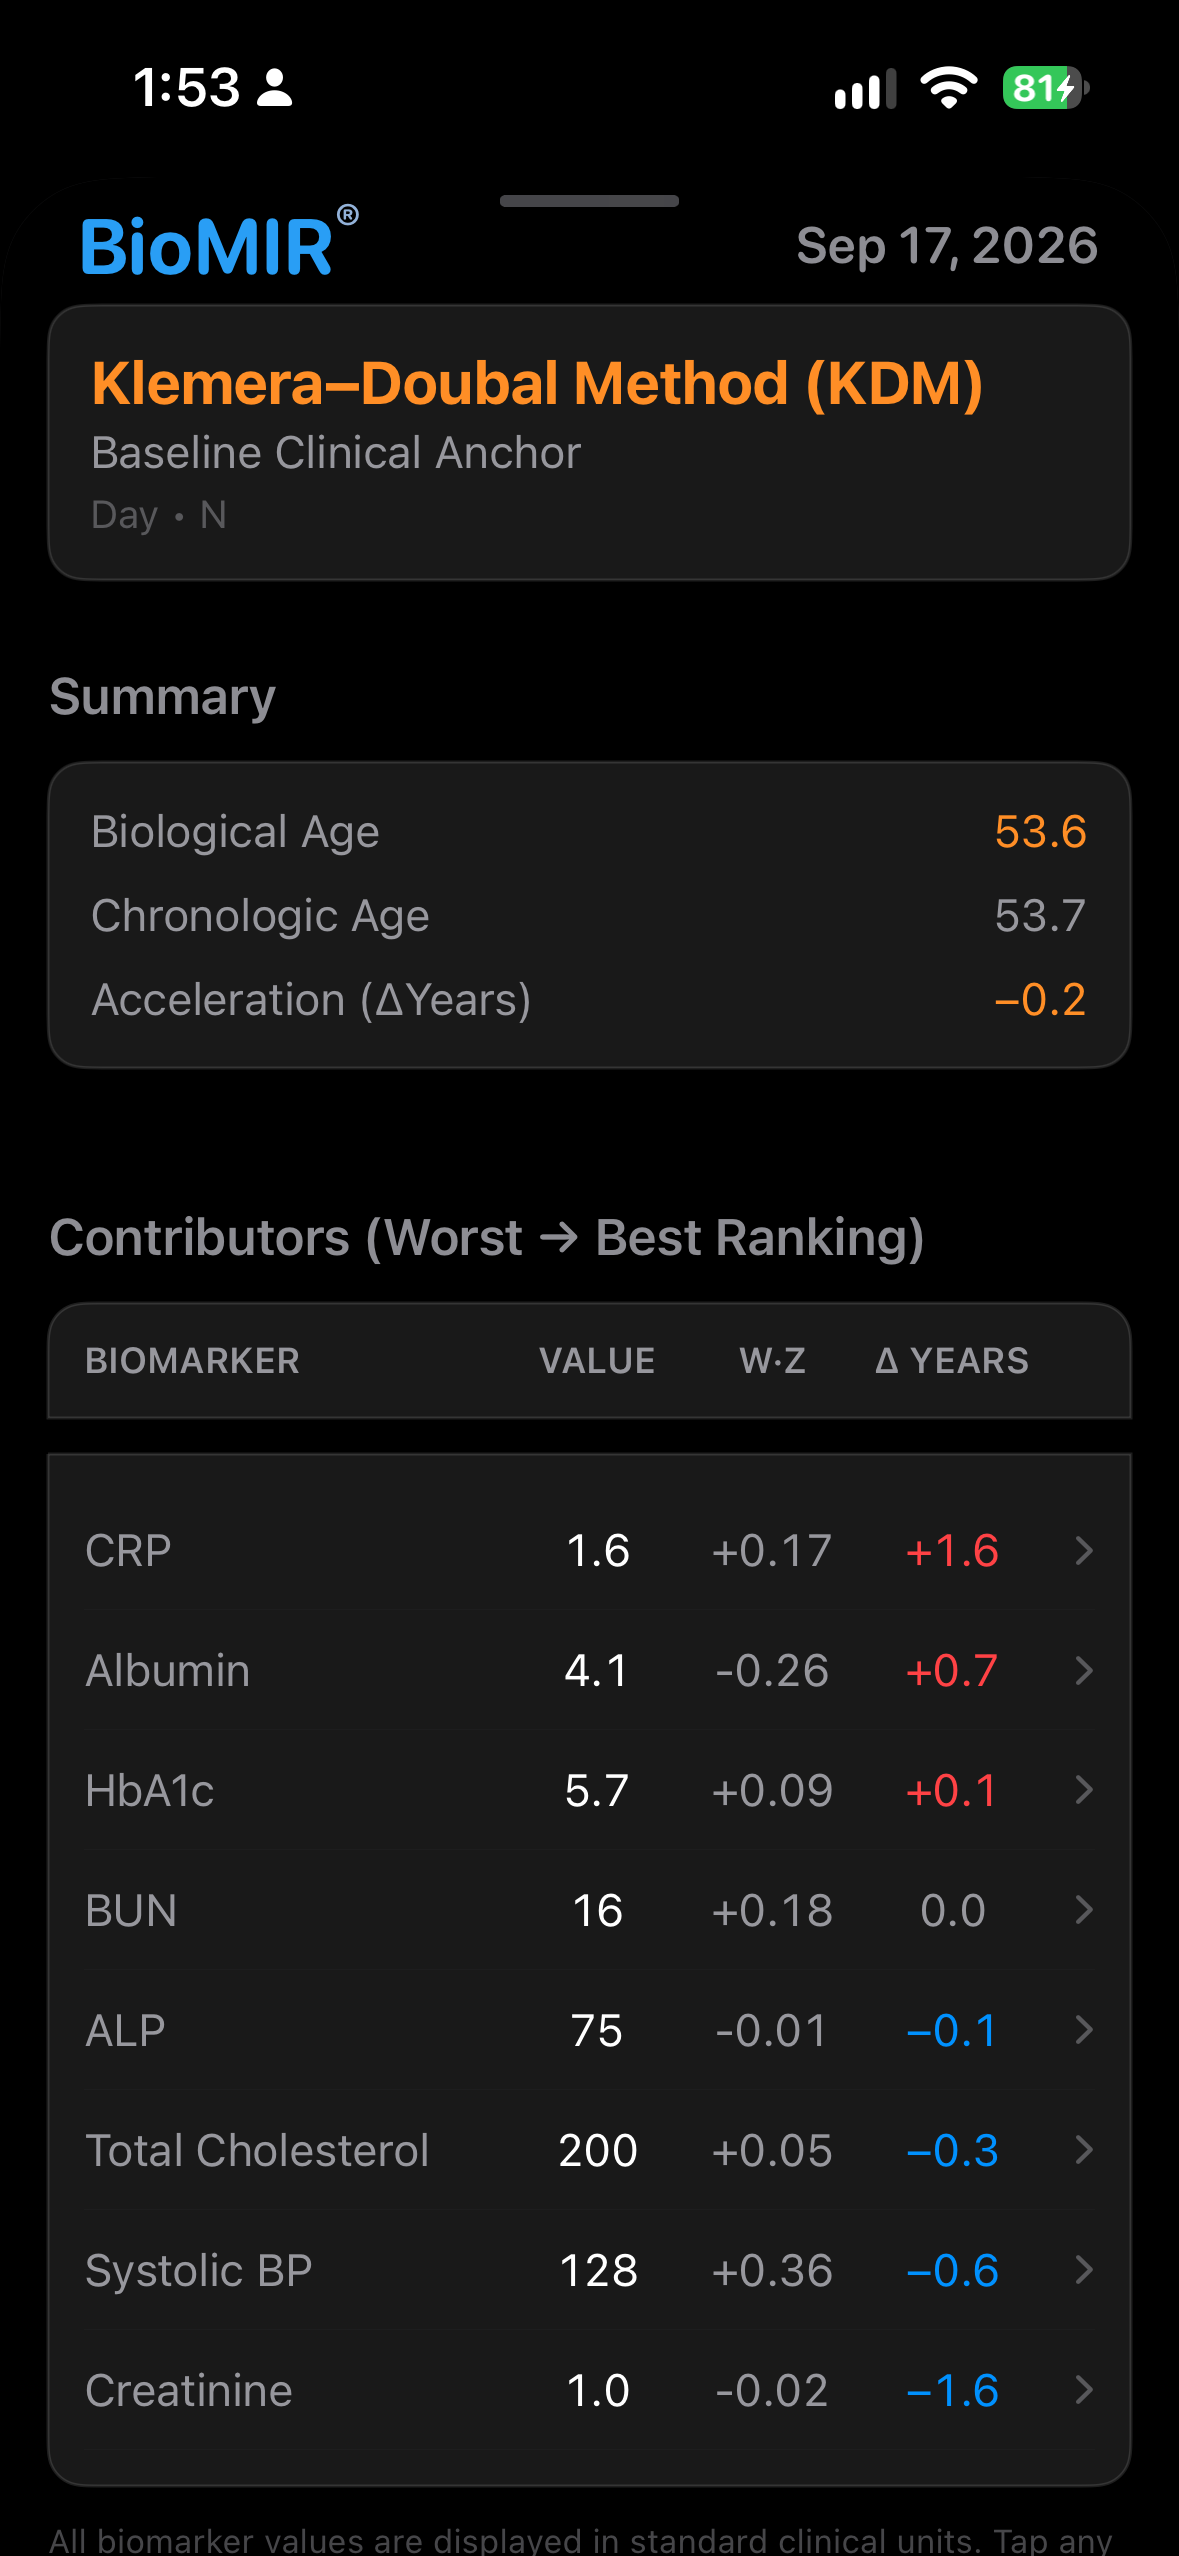
Move from Adaptive BioAge into Behavioral Adaptation, Recovery, and Cardiometabolic Anchors, then down to individual biomarkers. Each detail view connects the measured value to its reference context, model direction, weight, and signed Δ-year contribution so you can see what is pushing the estimate older or younger.

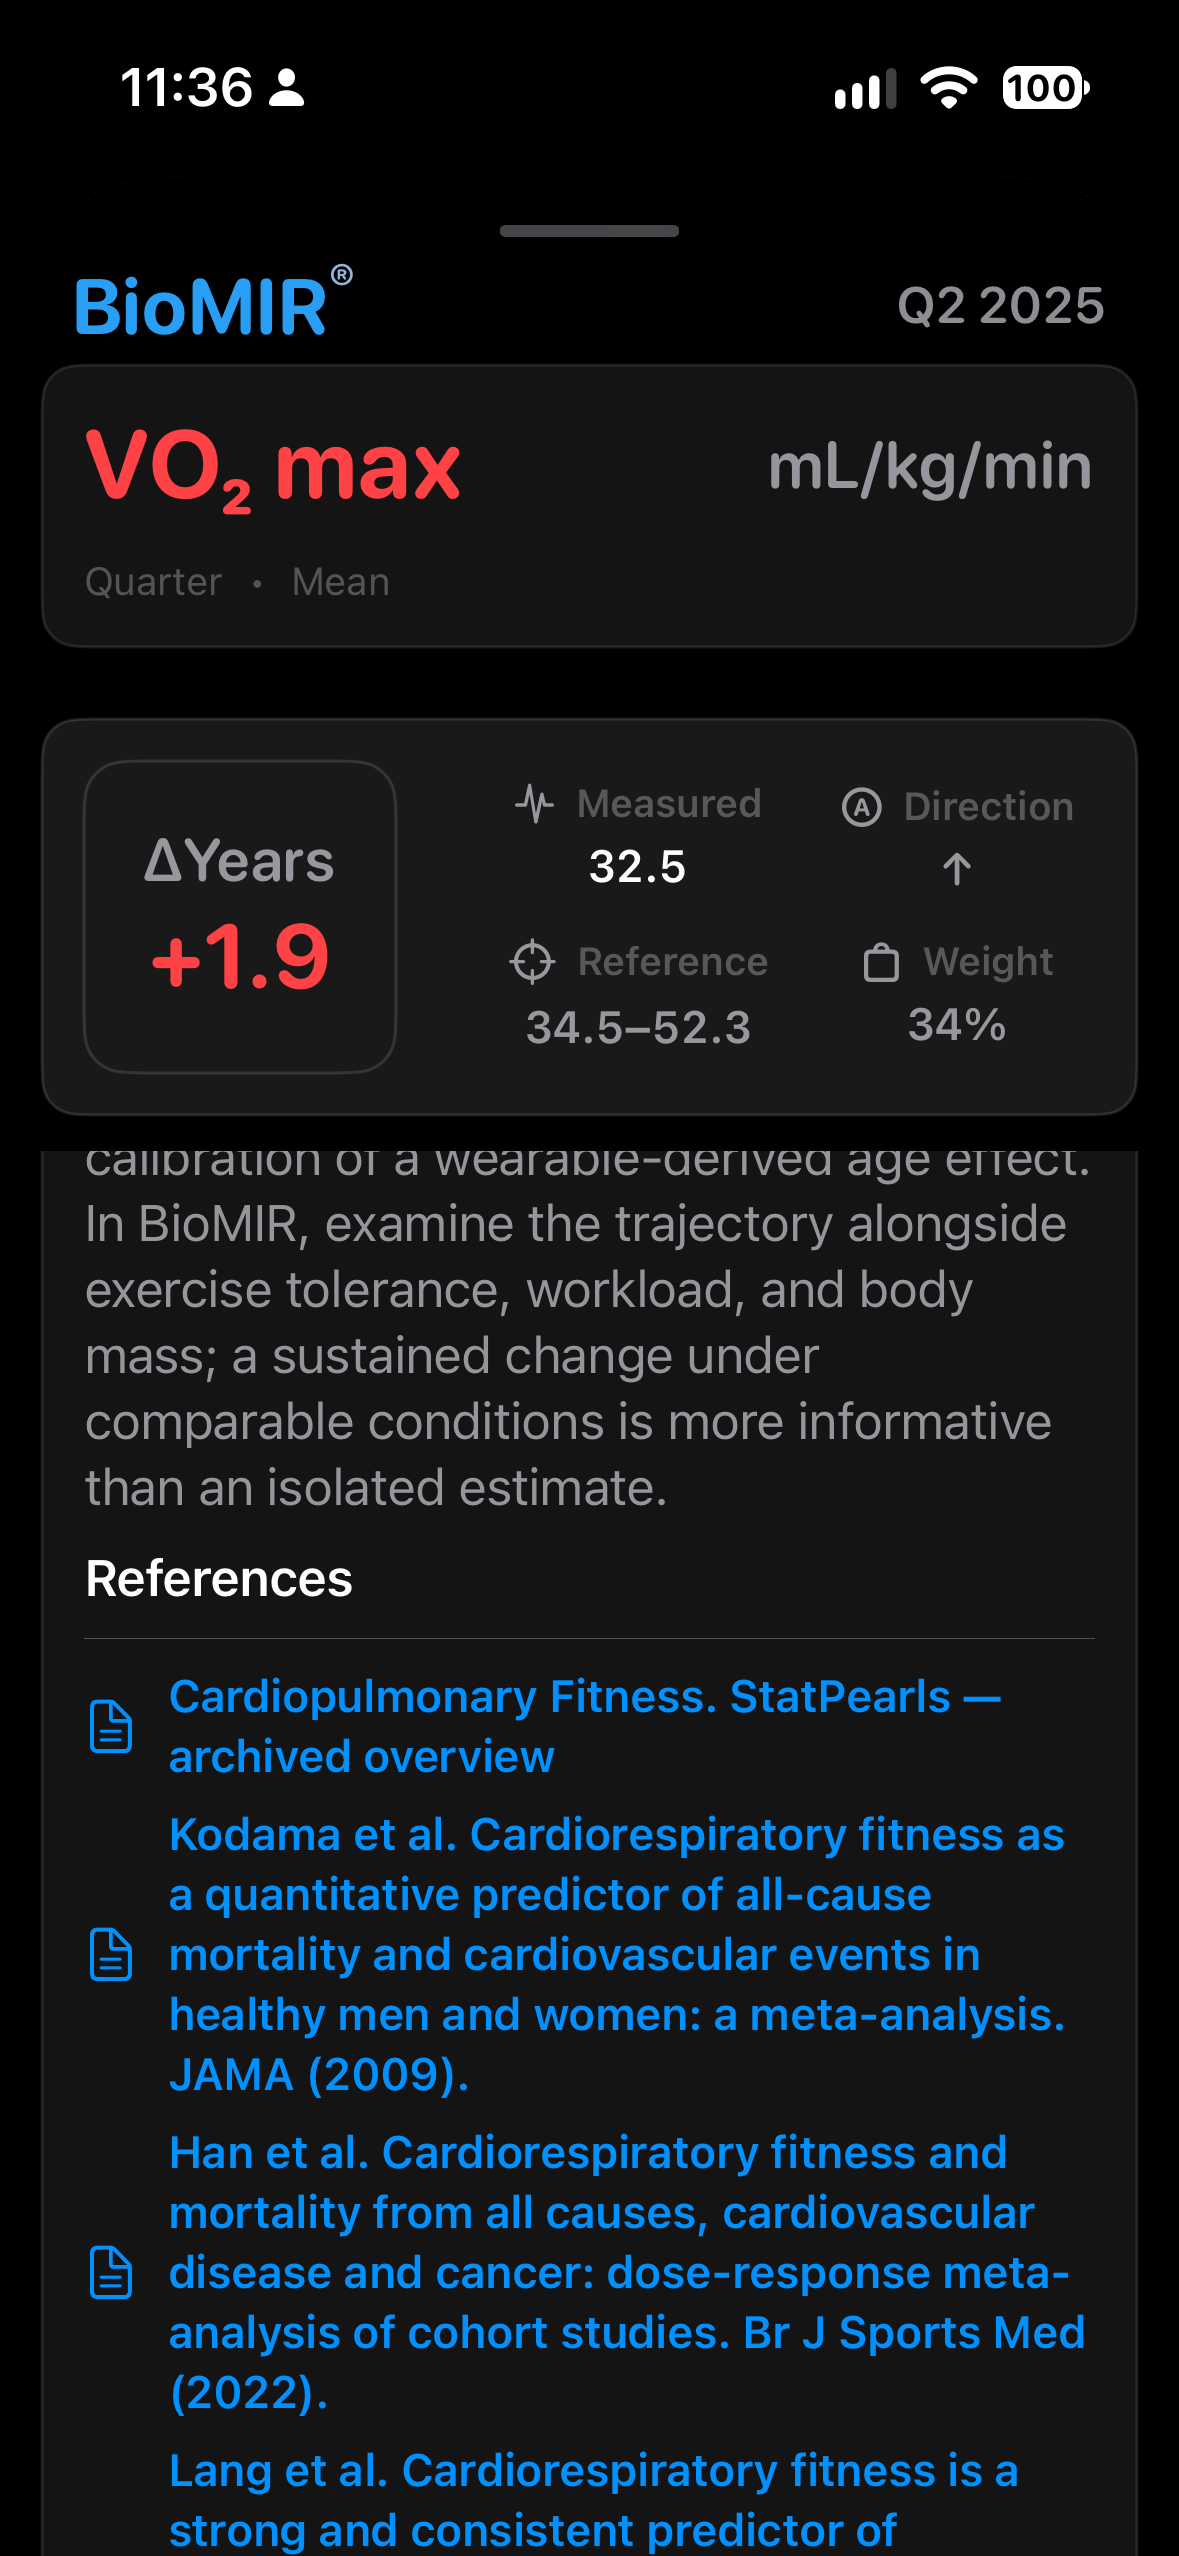
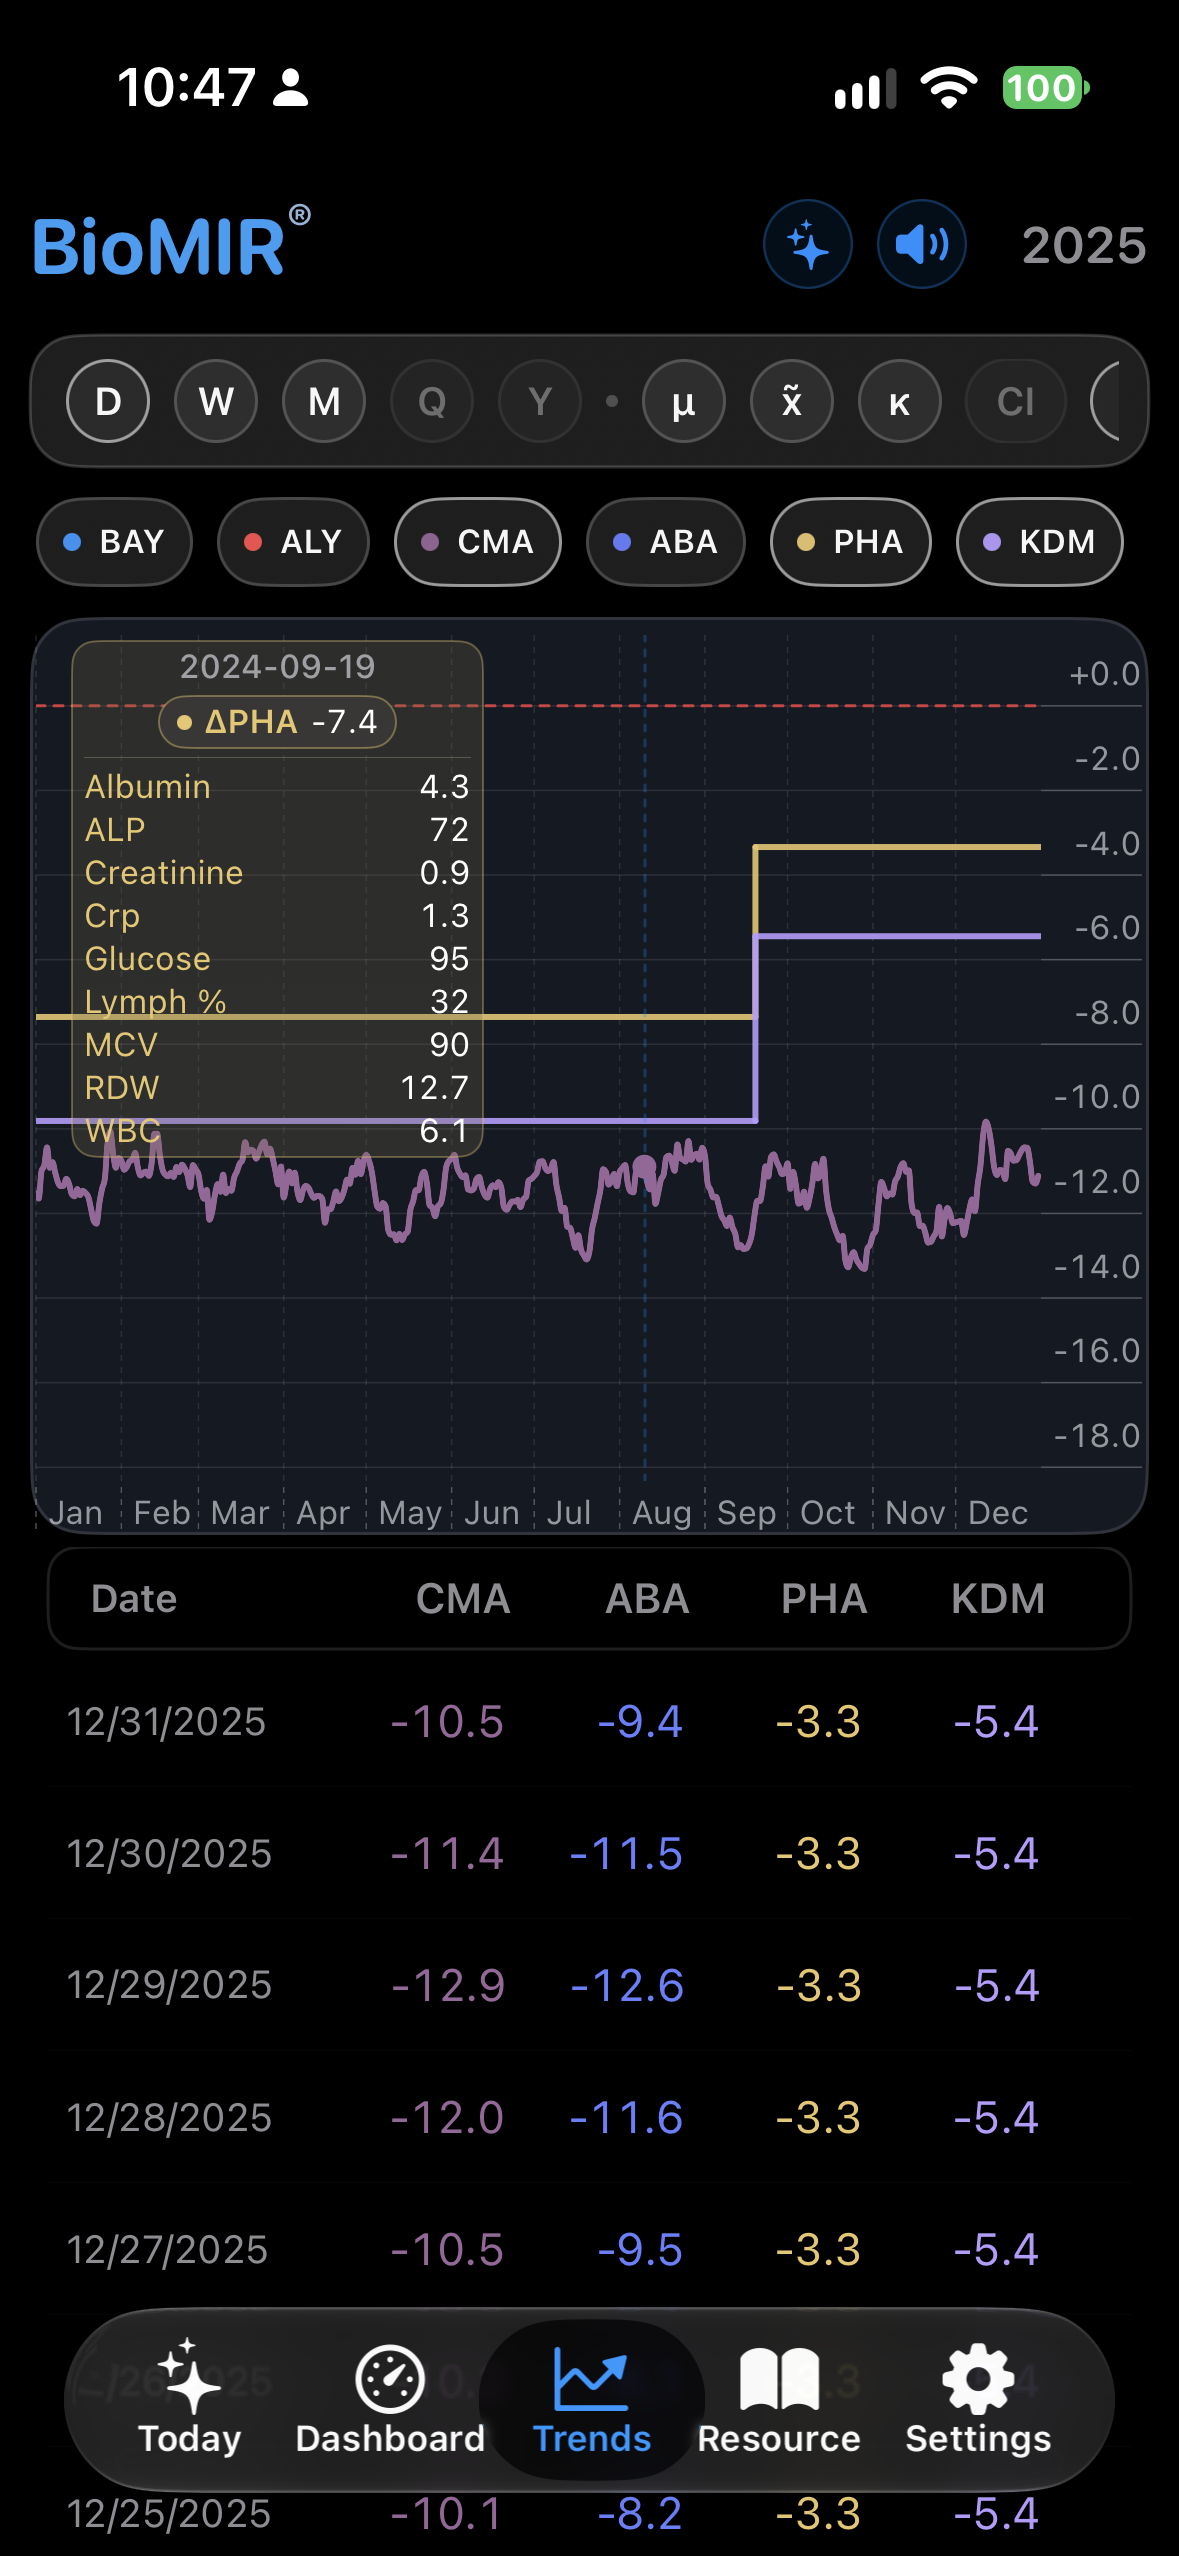
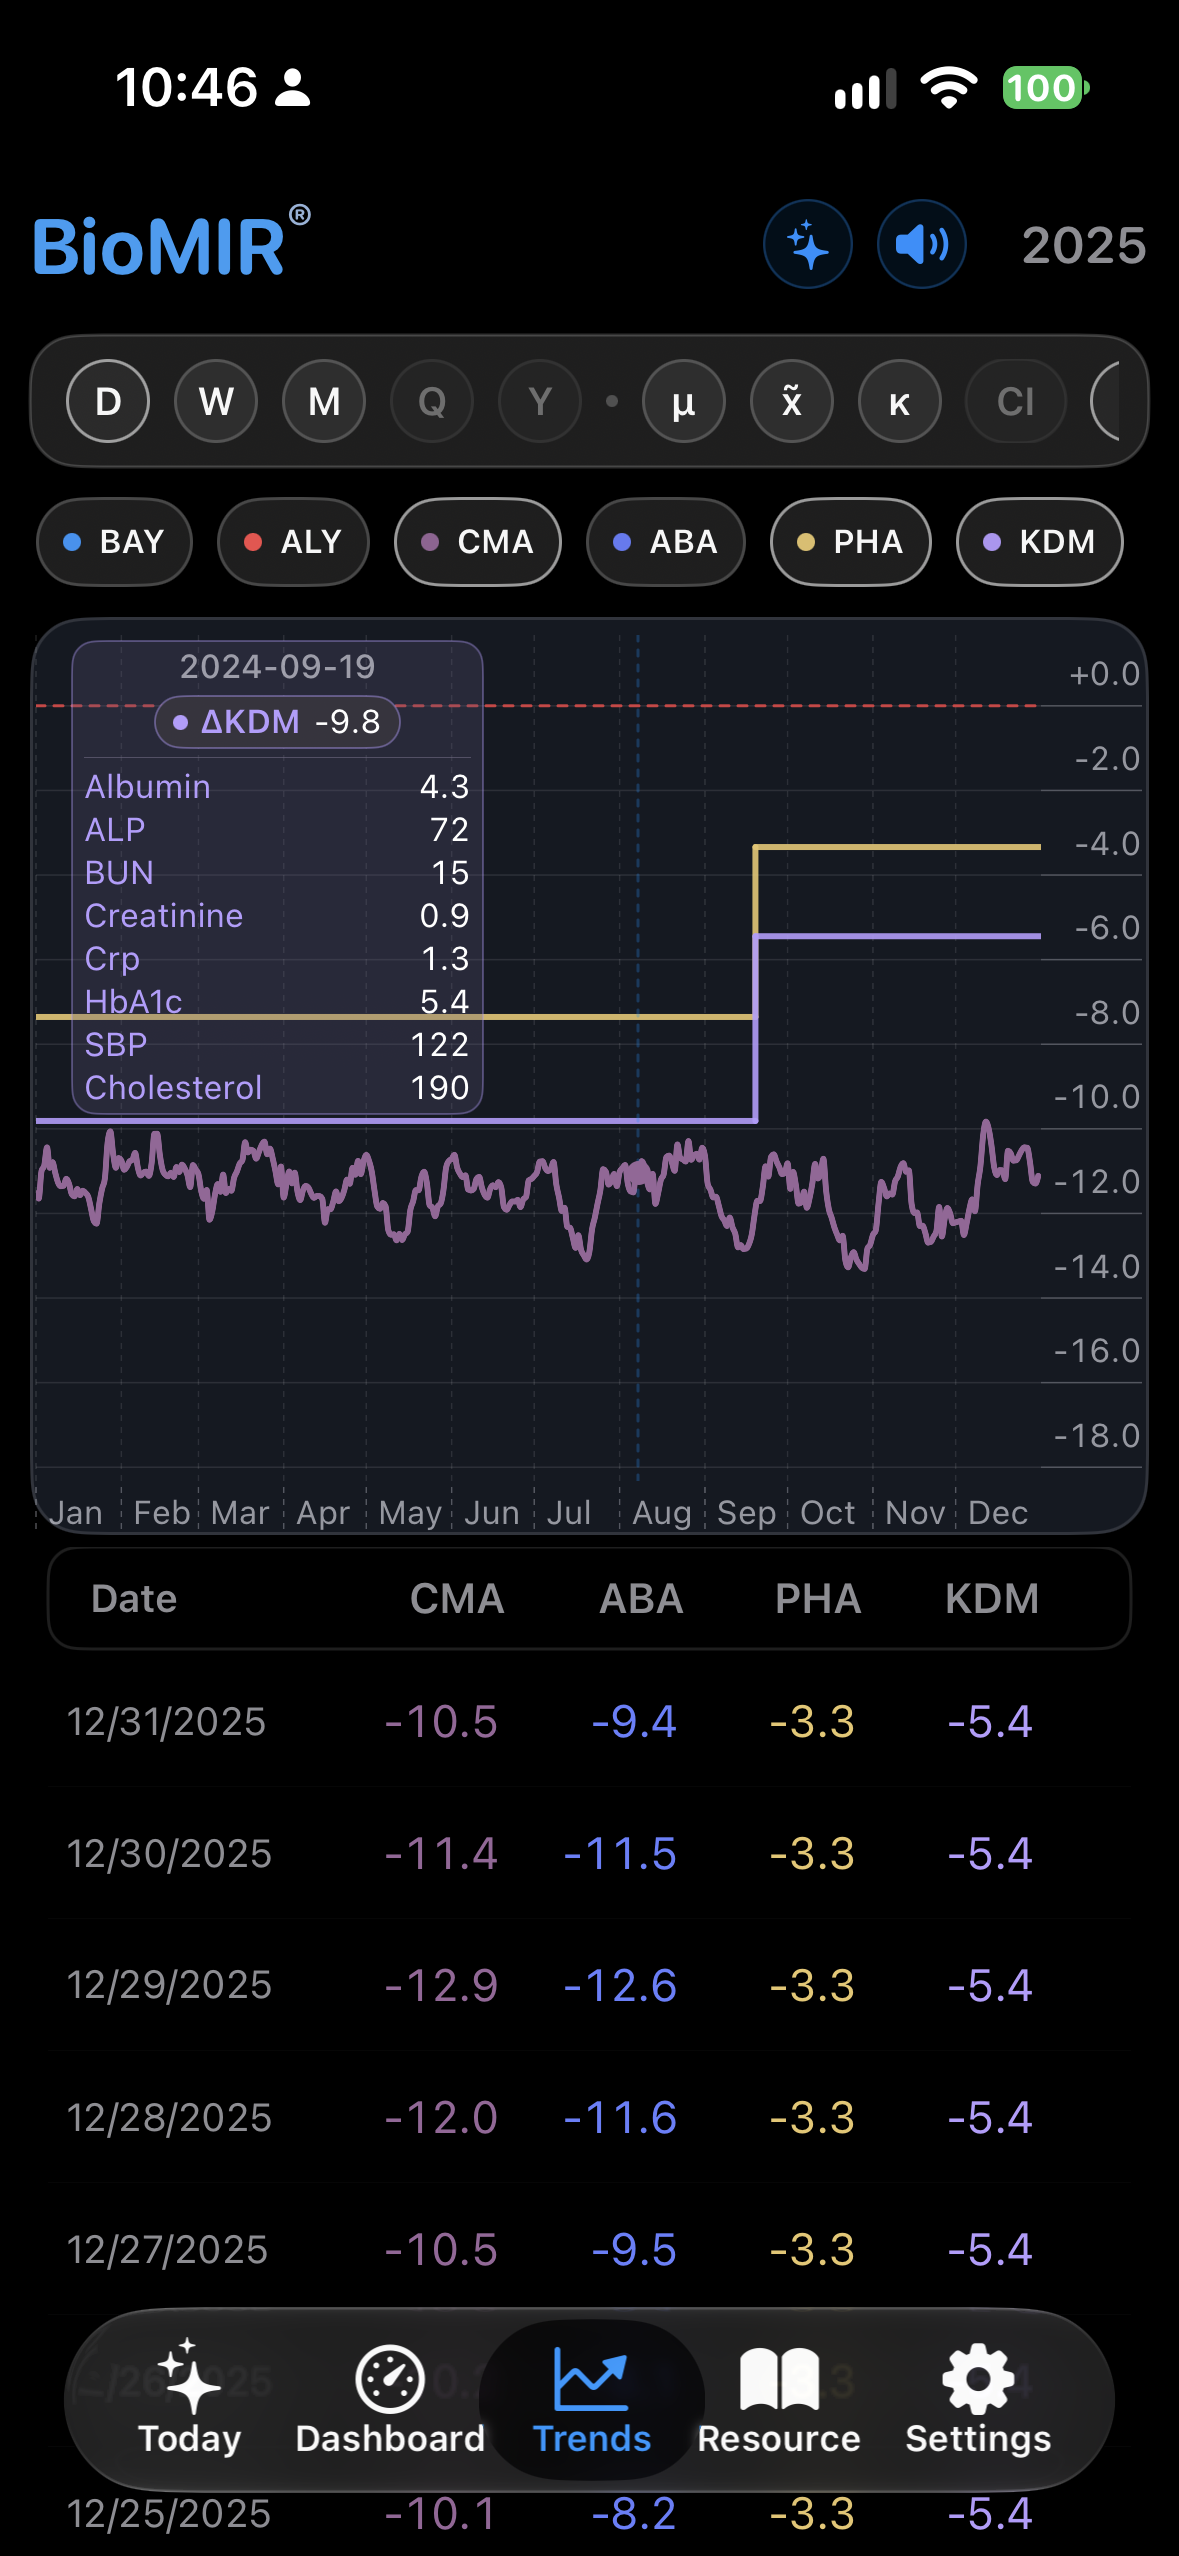
Where available, biomarker views add physiological interpretation, measurement context, supporting evidence, and suggested actions. KDM and Clinical PhenoAge provide complementary longer-horizon clinical-age context when the required laboratory data are present.

Dashboard · iPhone1 / 12
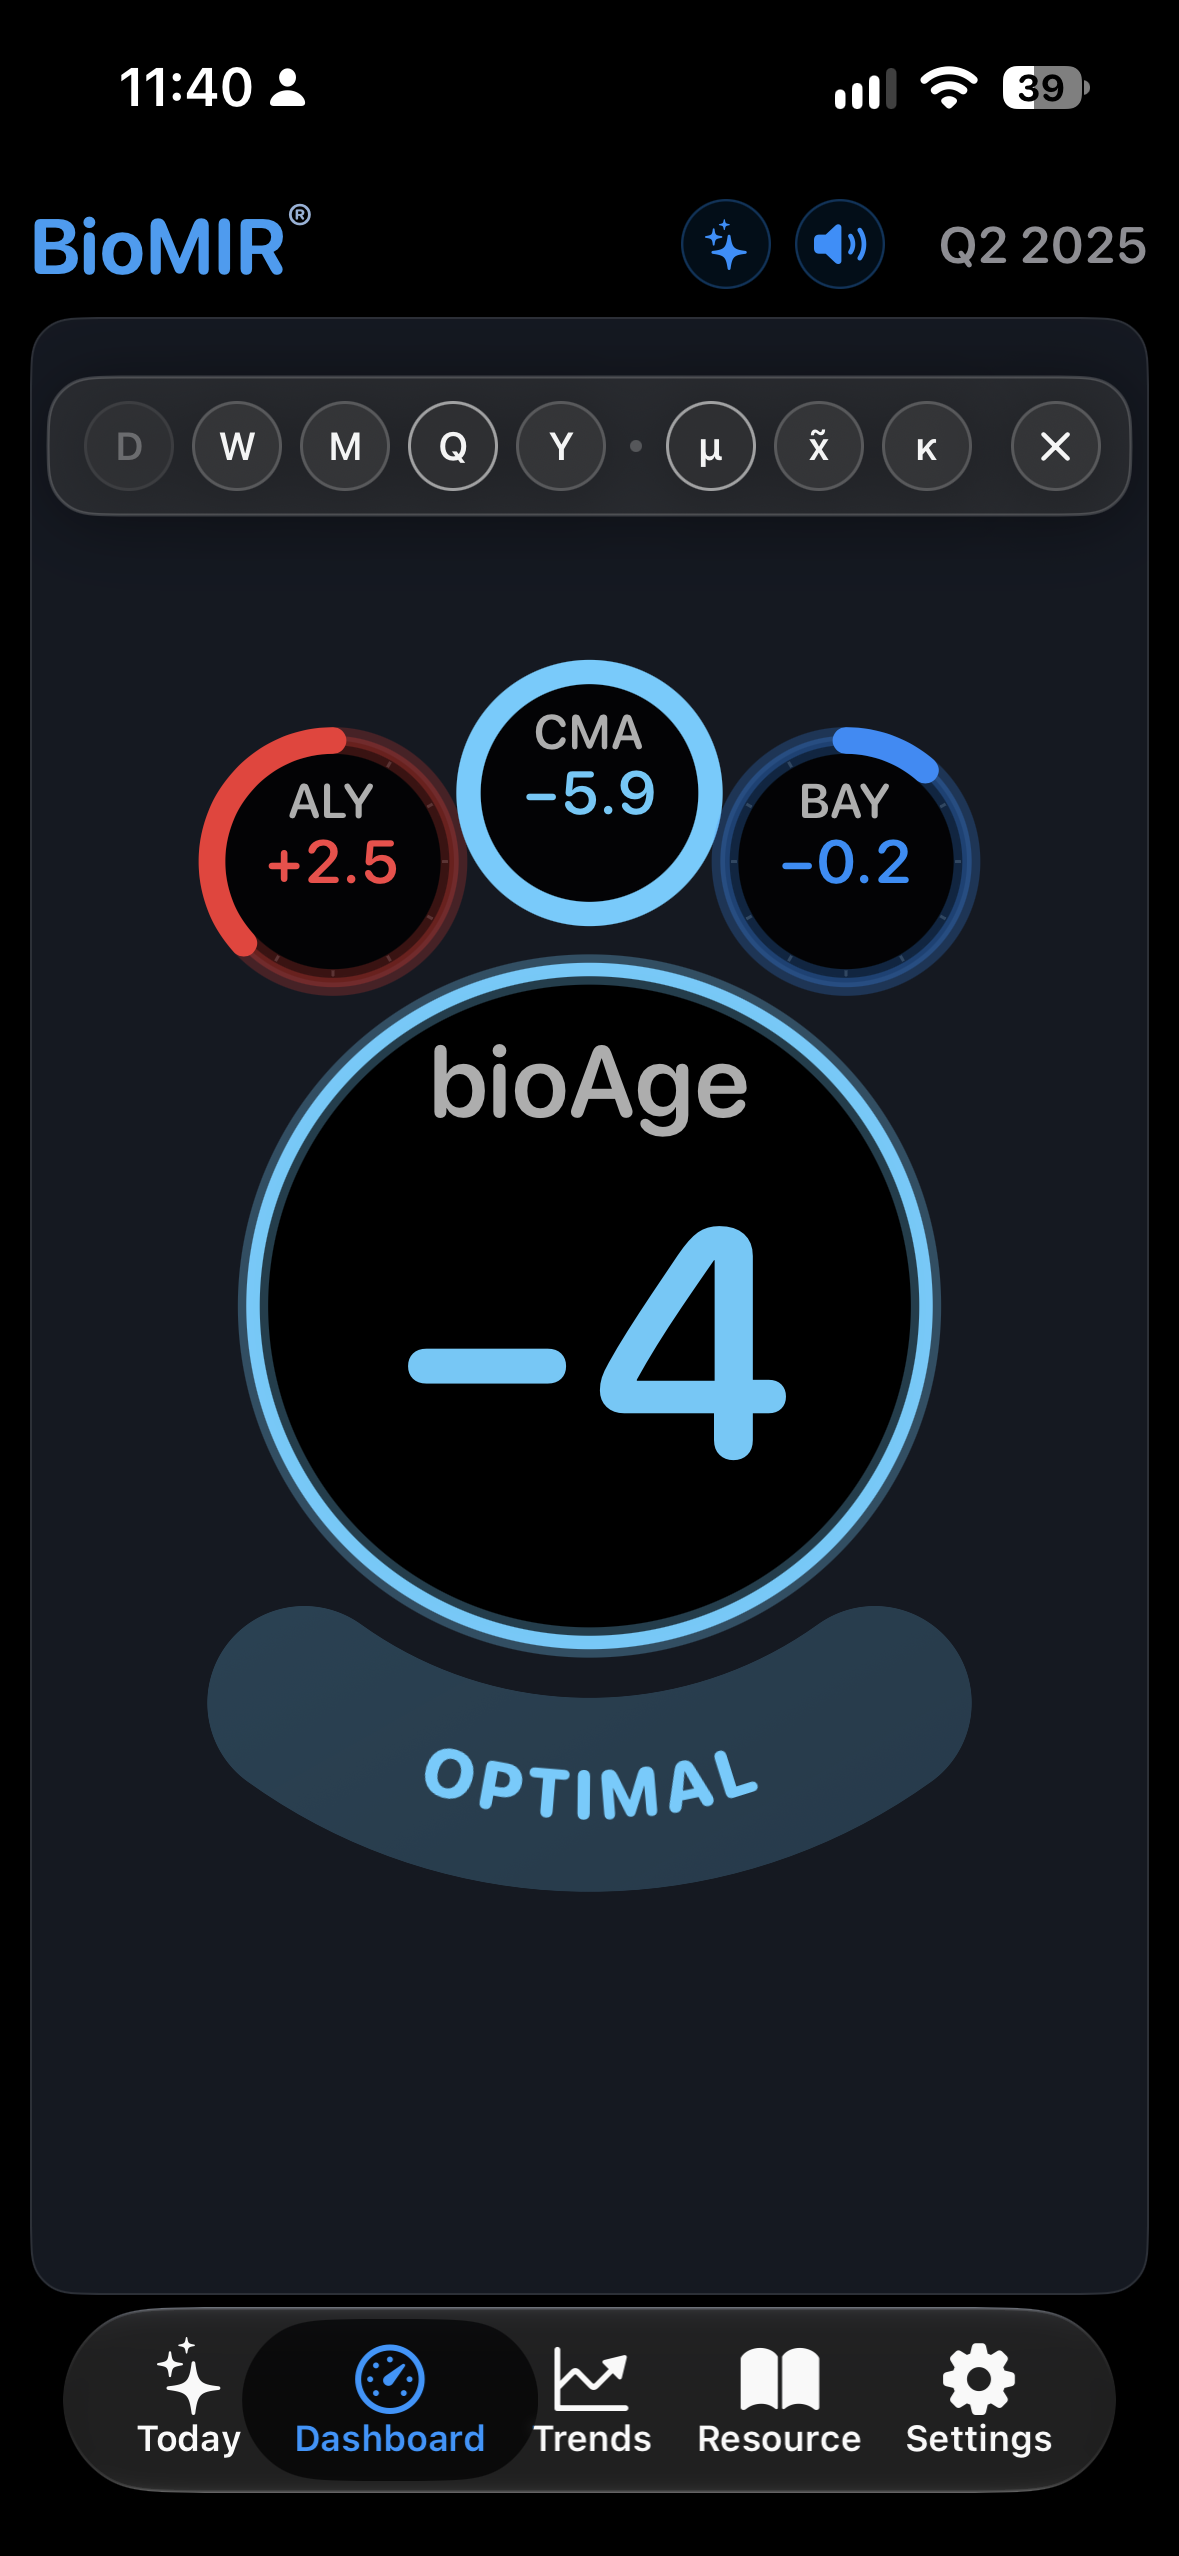
BioMIR Dashboard screenshot 1
Adaptive BioAge dashboard
BioMIR Dashboard screenshot 2
Adaptive BioAge dashboard
BioMIR Dashboard screenshot 3
Adaptive BioAge dashboard
BioMIR Dashboard screenshot 4
Adaptive BioAge dashboard
BioMIR Dashboard screenshot 5
Adaptive BioAge dashboard
BioMIR Dashboard screenshot 6
Adaptive BioAge dashboard
BioMIR Dashboard screenshot 7
Adaptive BioAge dashboard
BioMIR Dashboard screenshot 8
Adaptive BioAge dashboard
BioMIR Dashboard screenshot 9
Adaptive BioAge dashboard
BioMIR Dashboard screenshot 10
Adaptive BioAge dashboard
BioMIR Dashboard screenshot 11
Adaptive BioAge dashboard
BioMIR Dashboard screenshot 12
Adaptive BioAge dashboard
Swipe to explore · Tap to enlarge
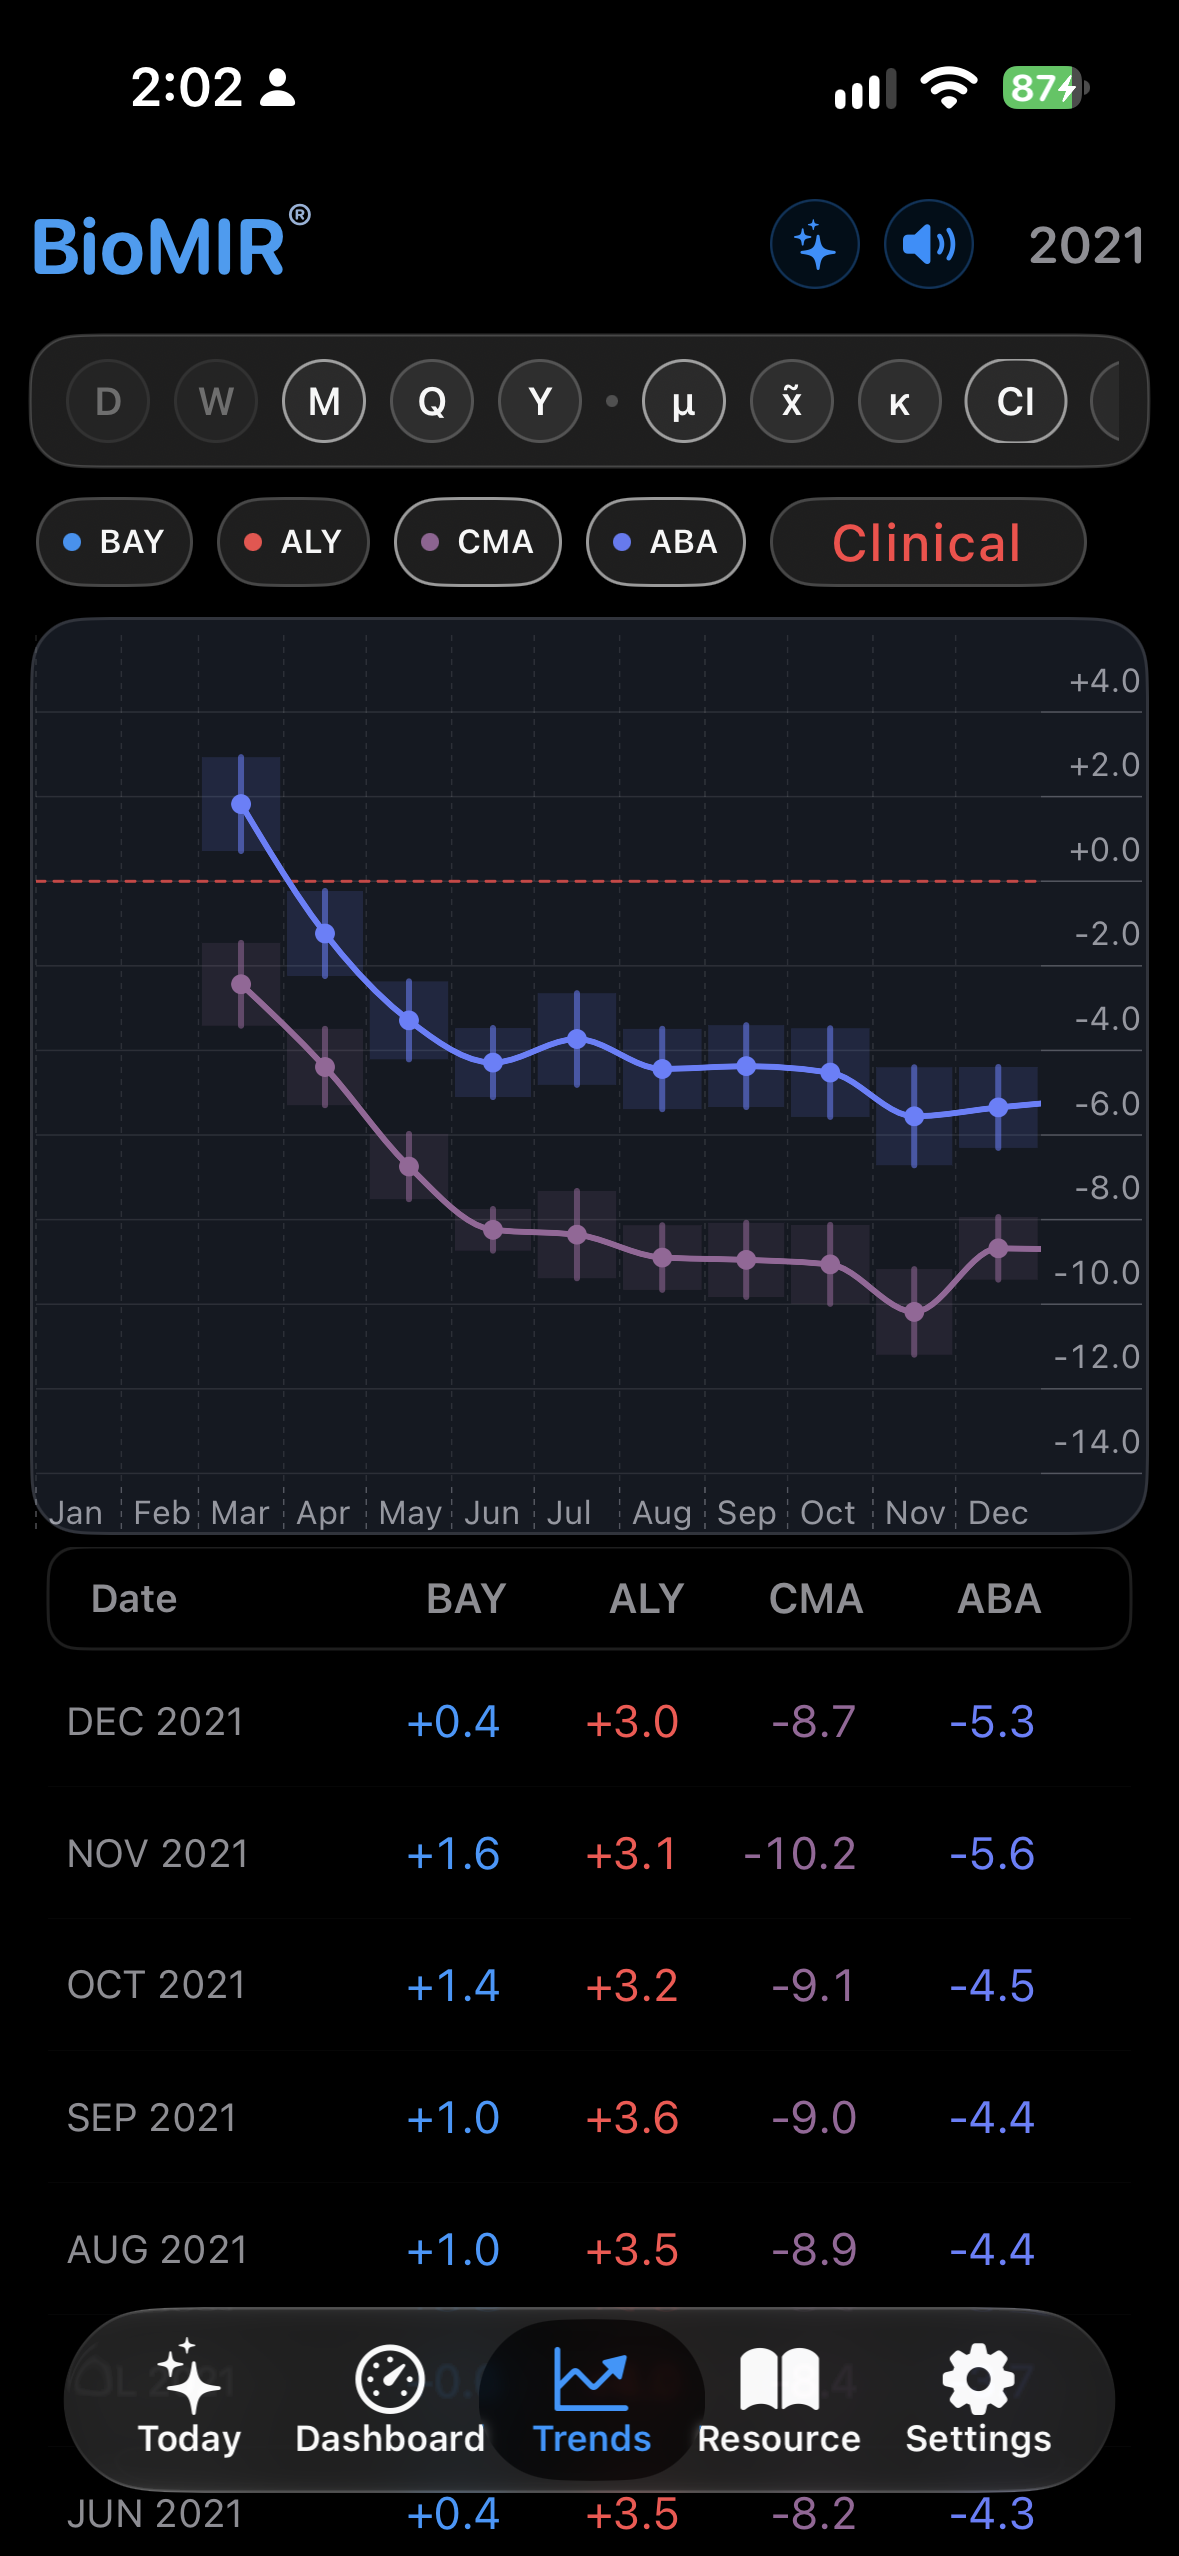
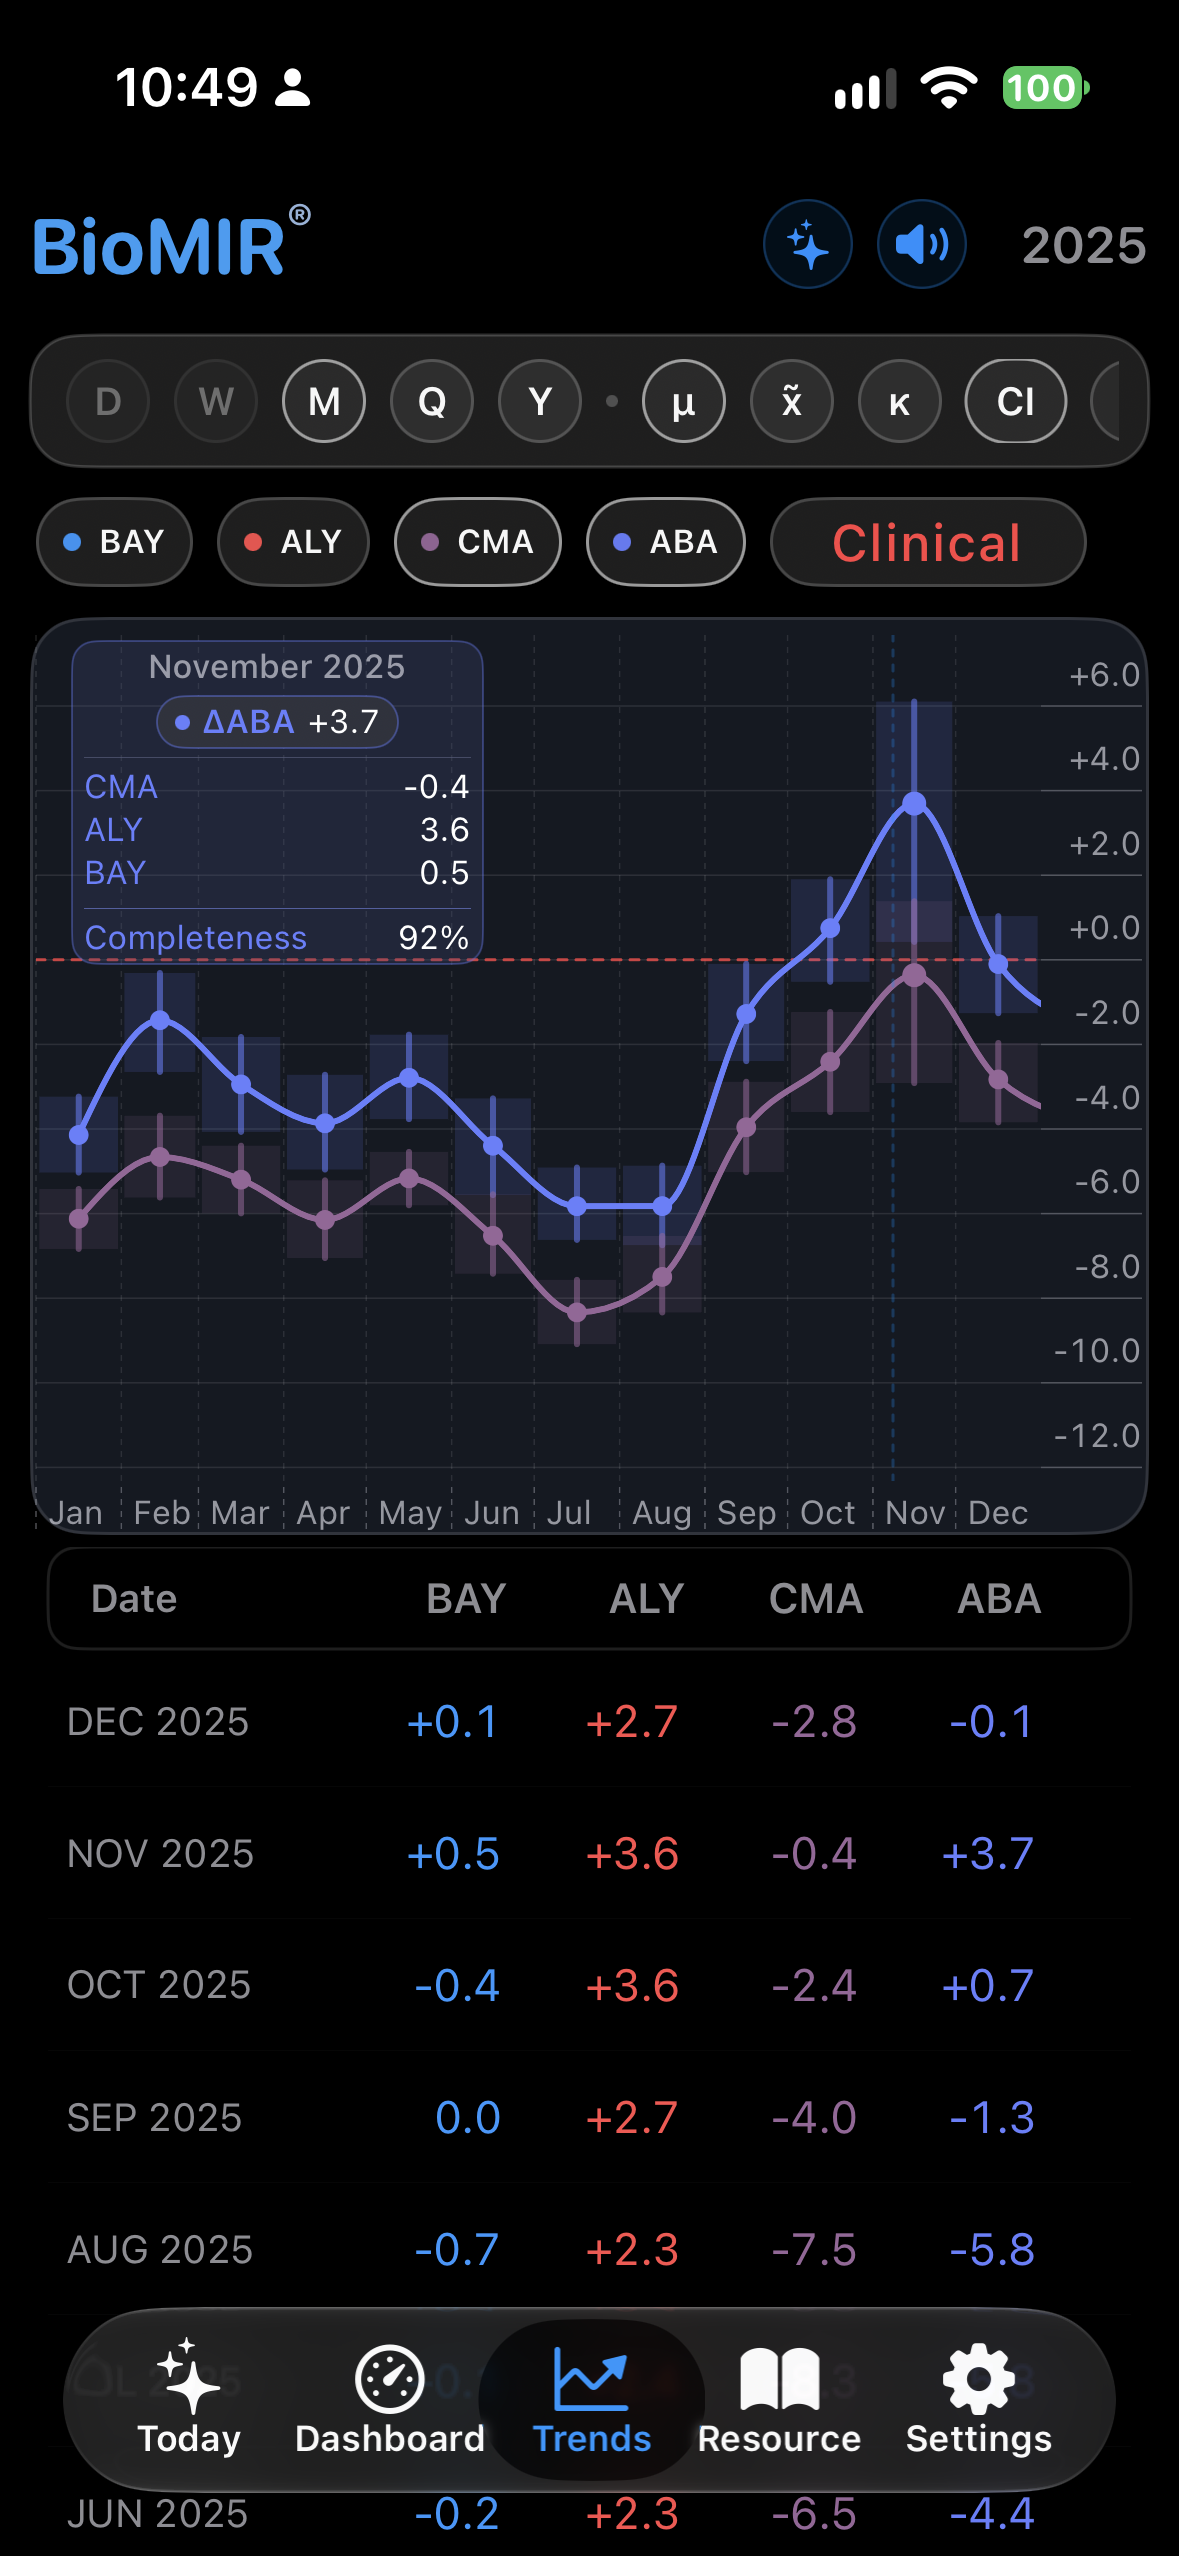
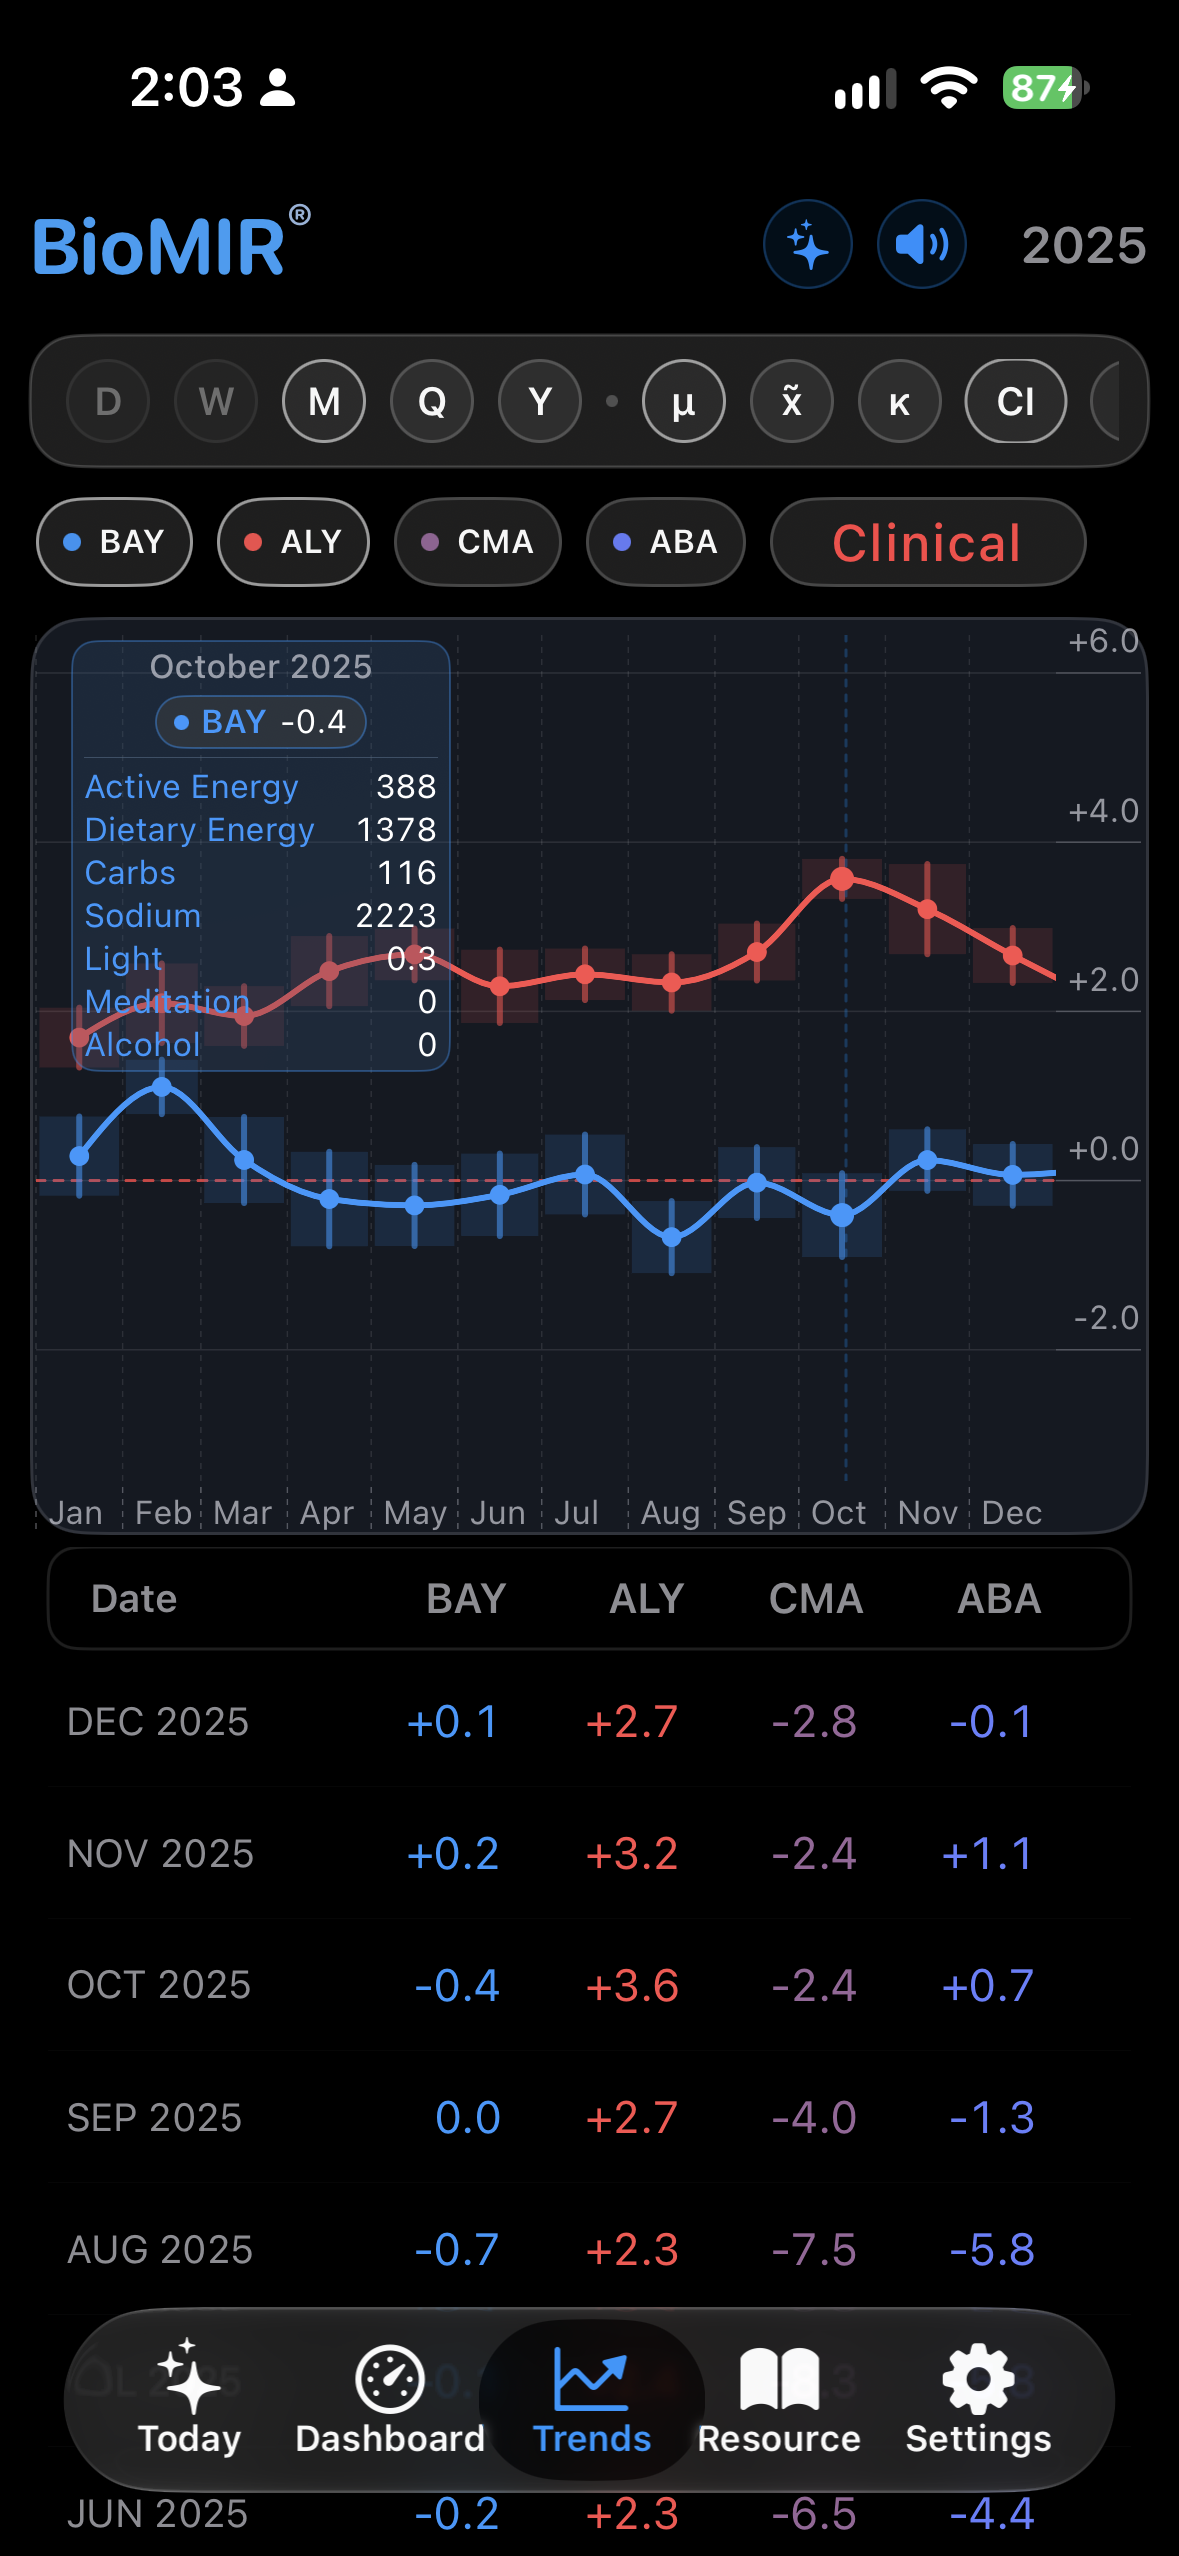
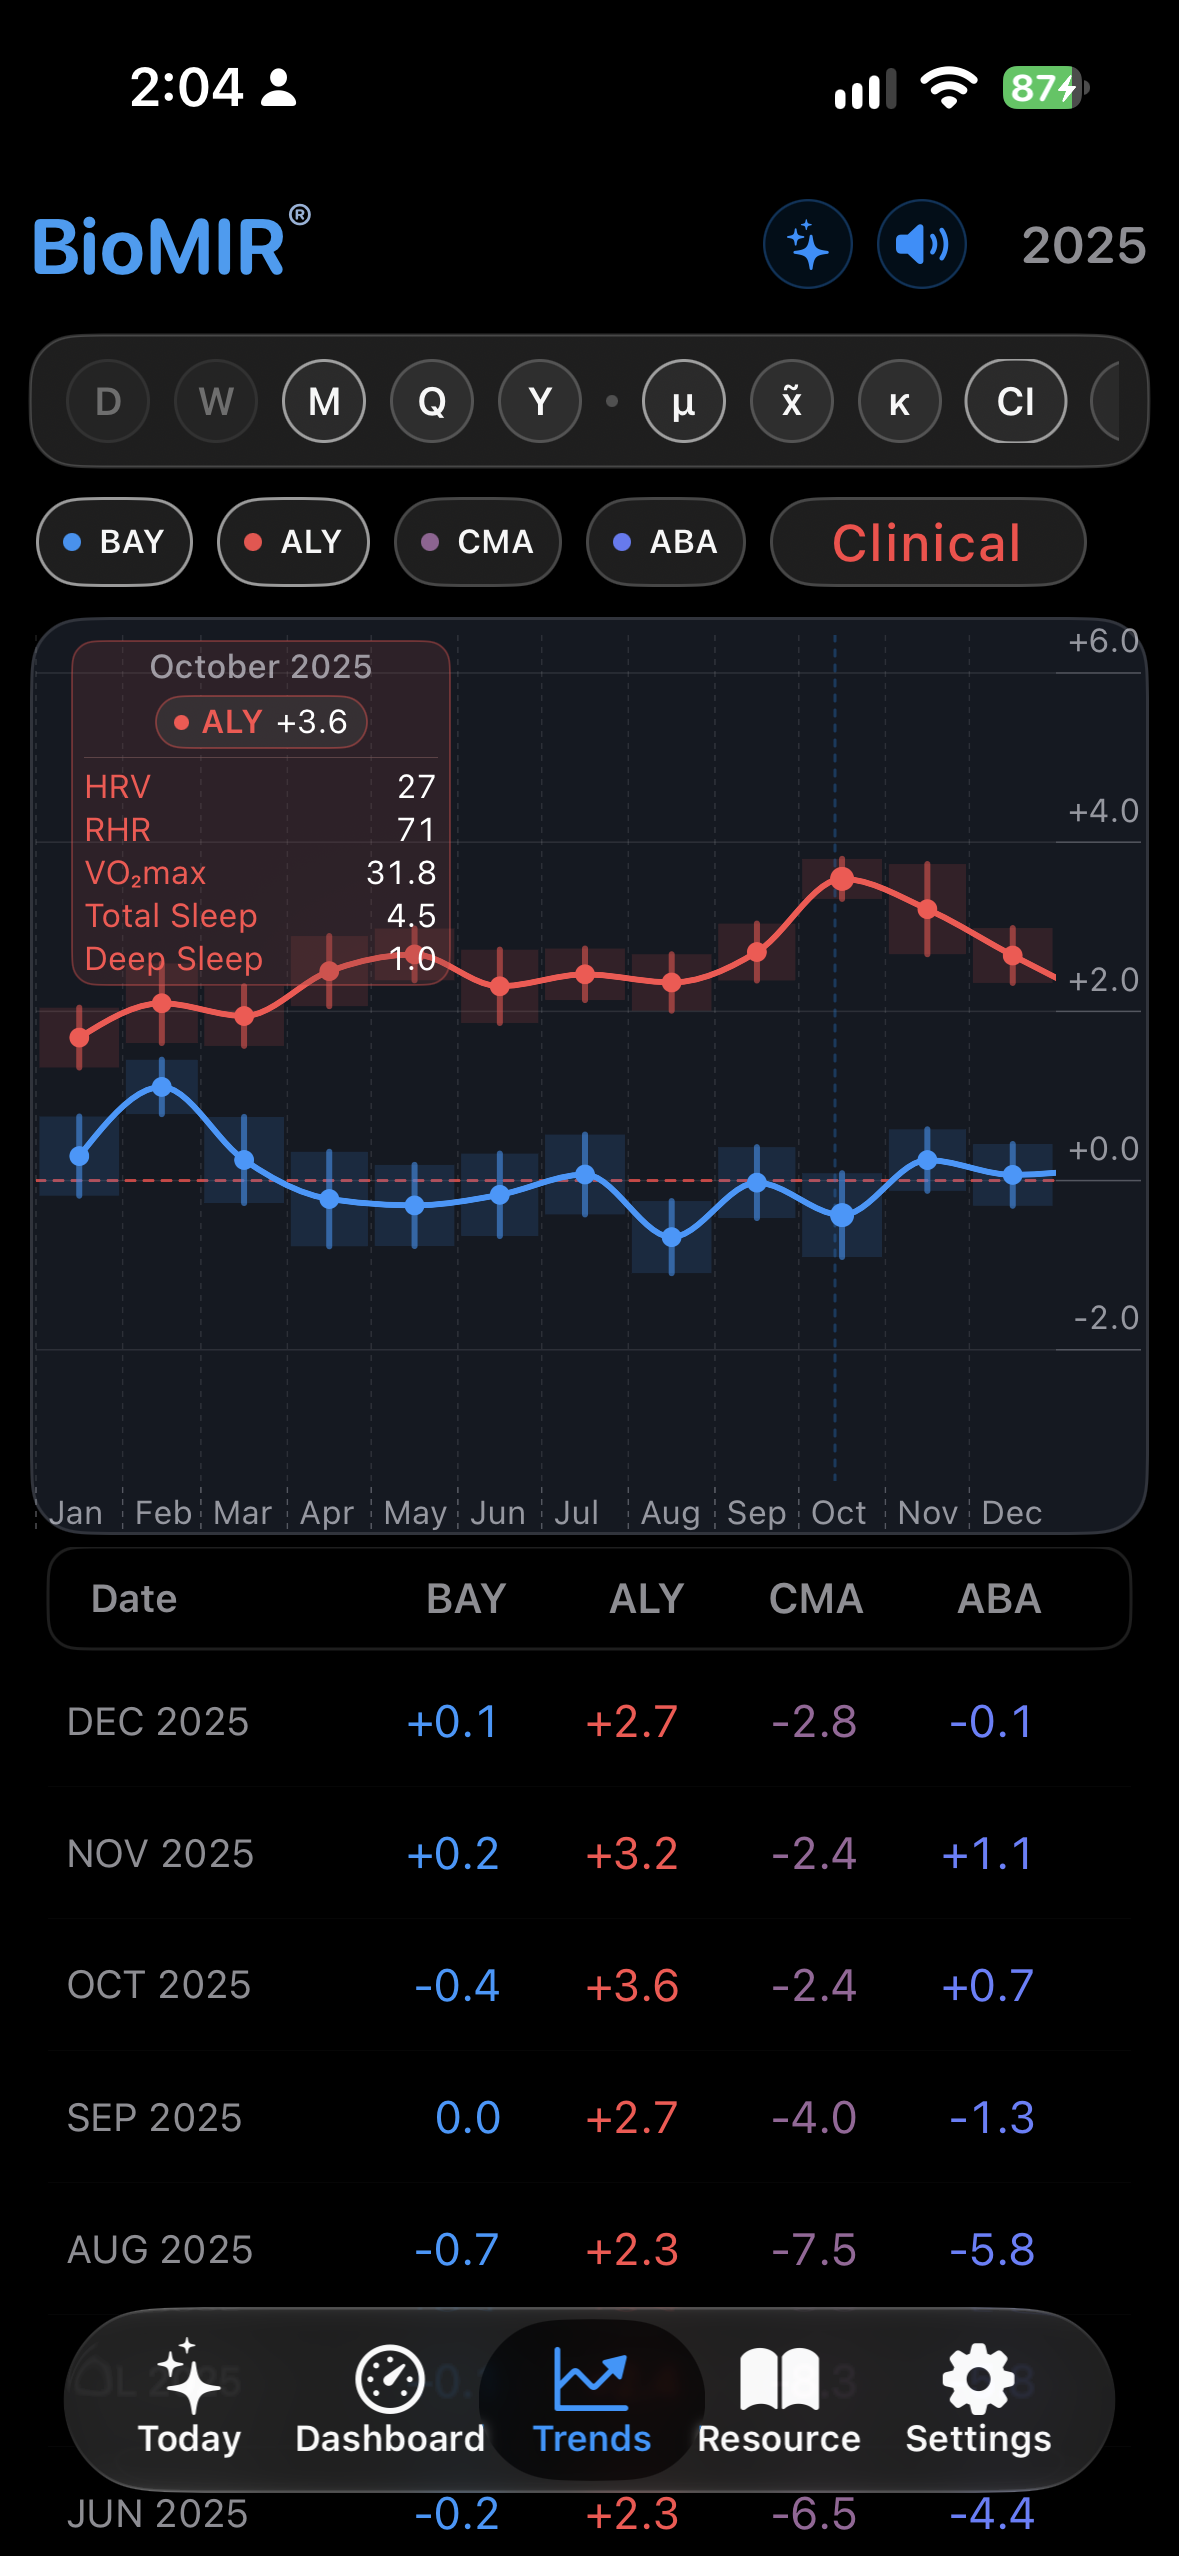
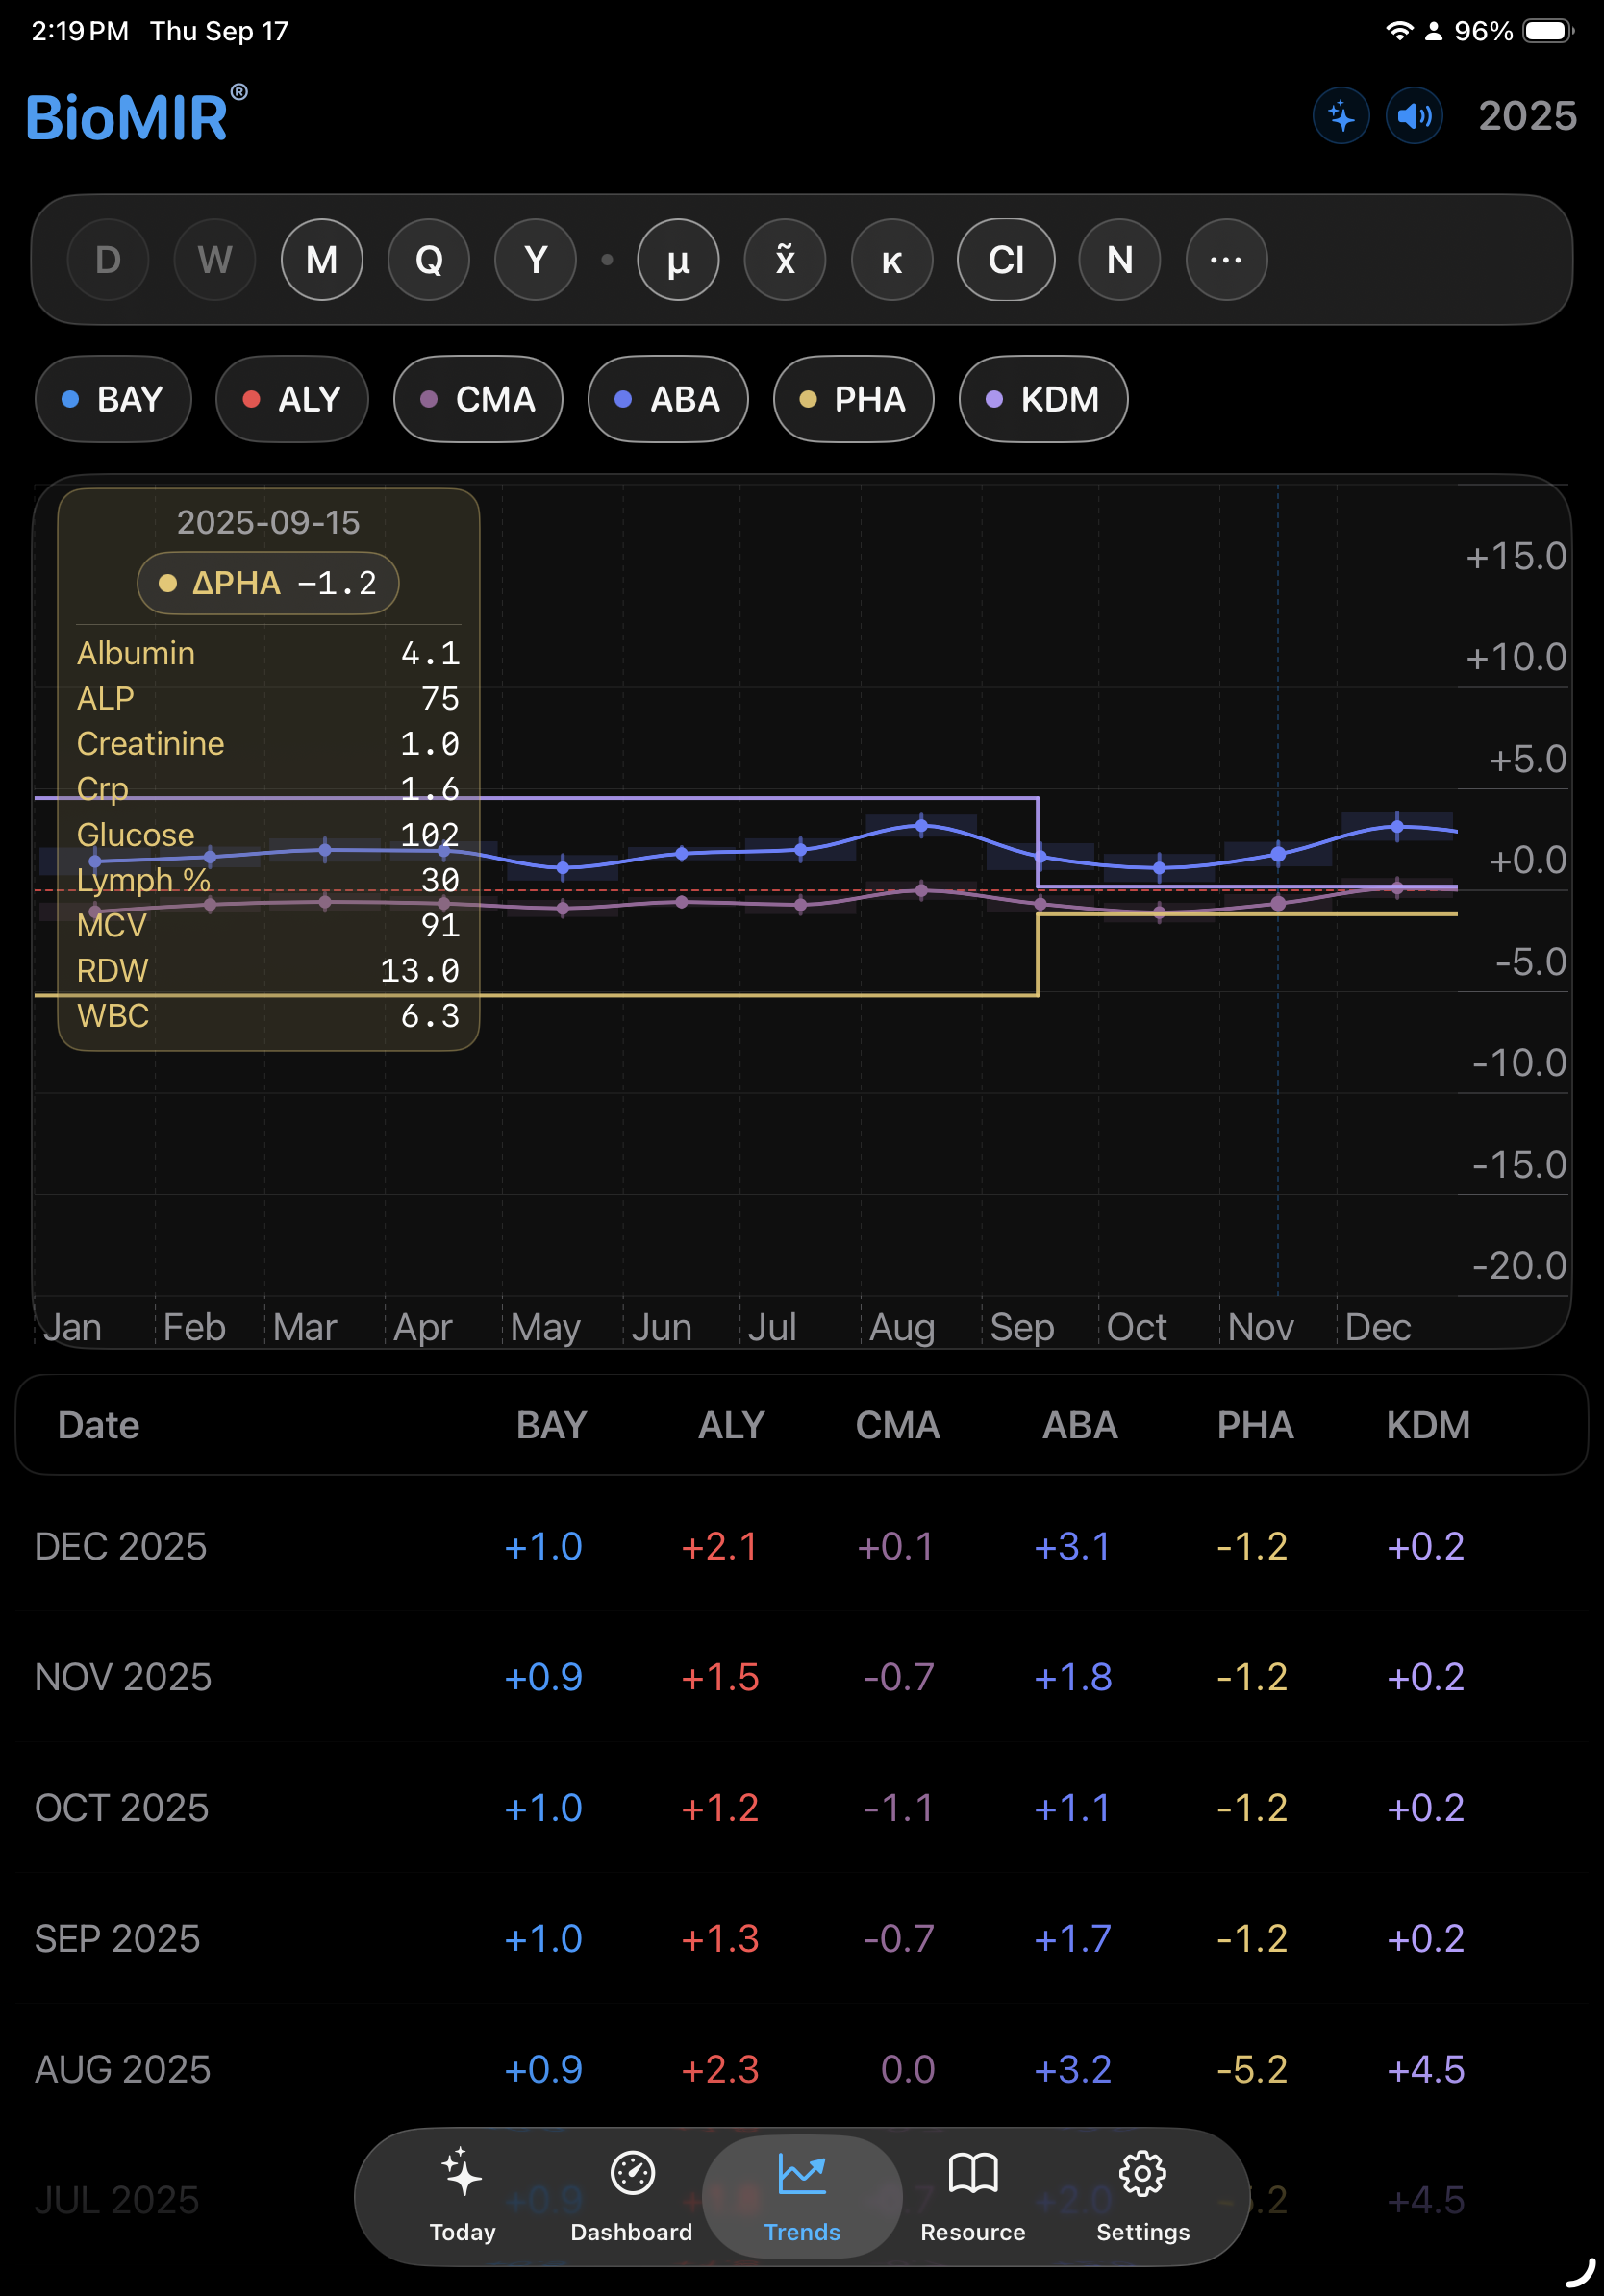
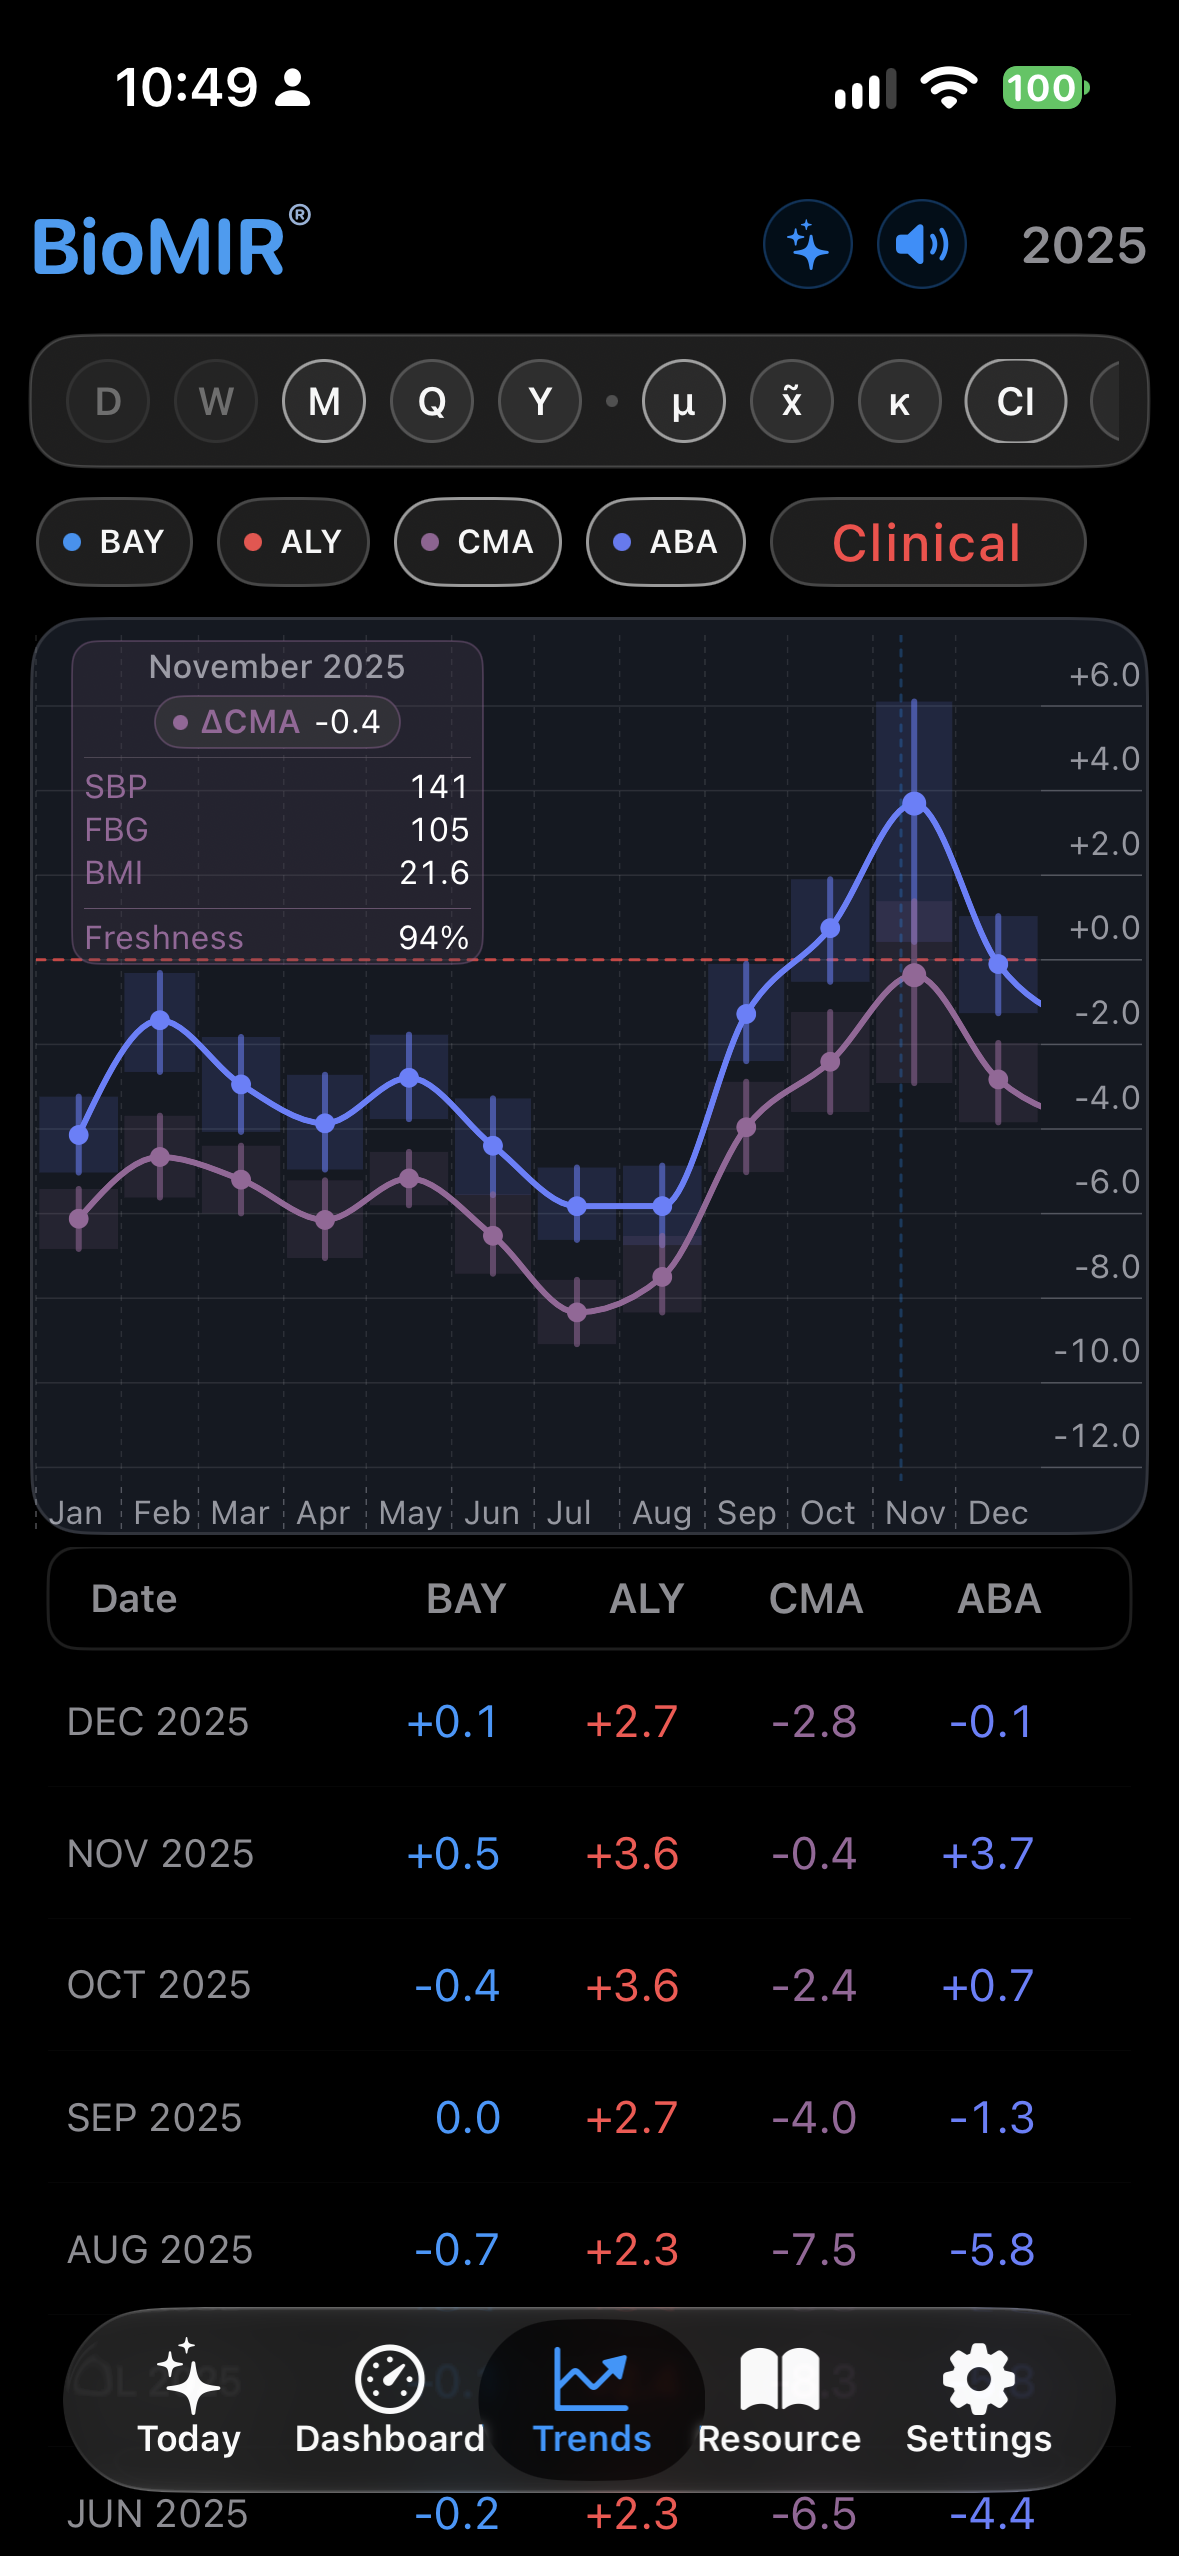
Trends: compare the pattern over time

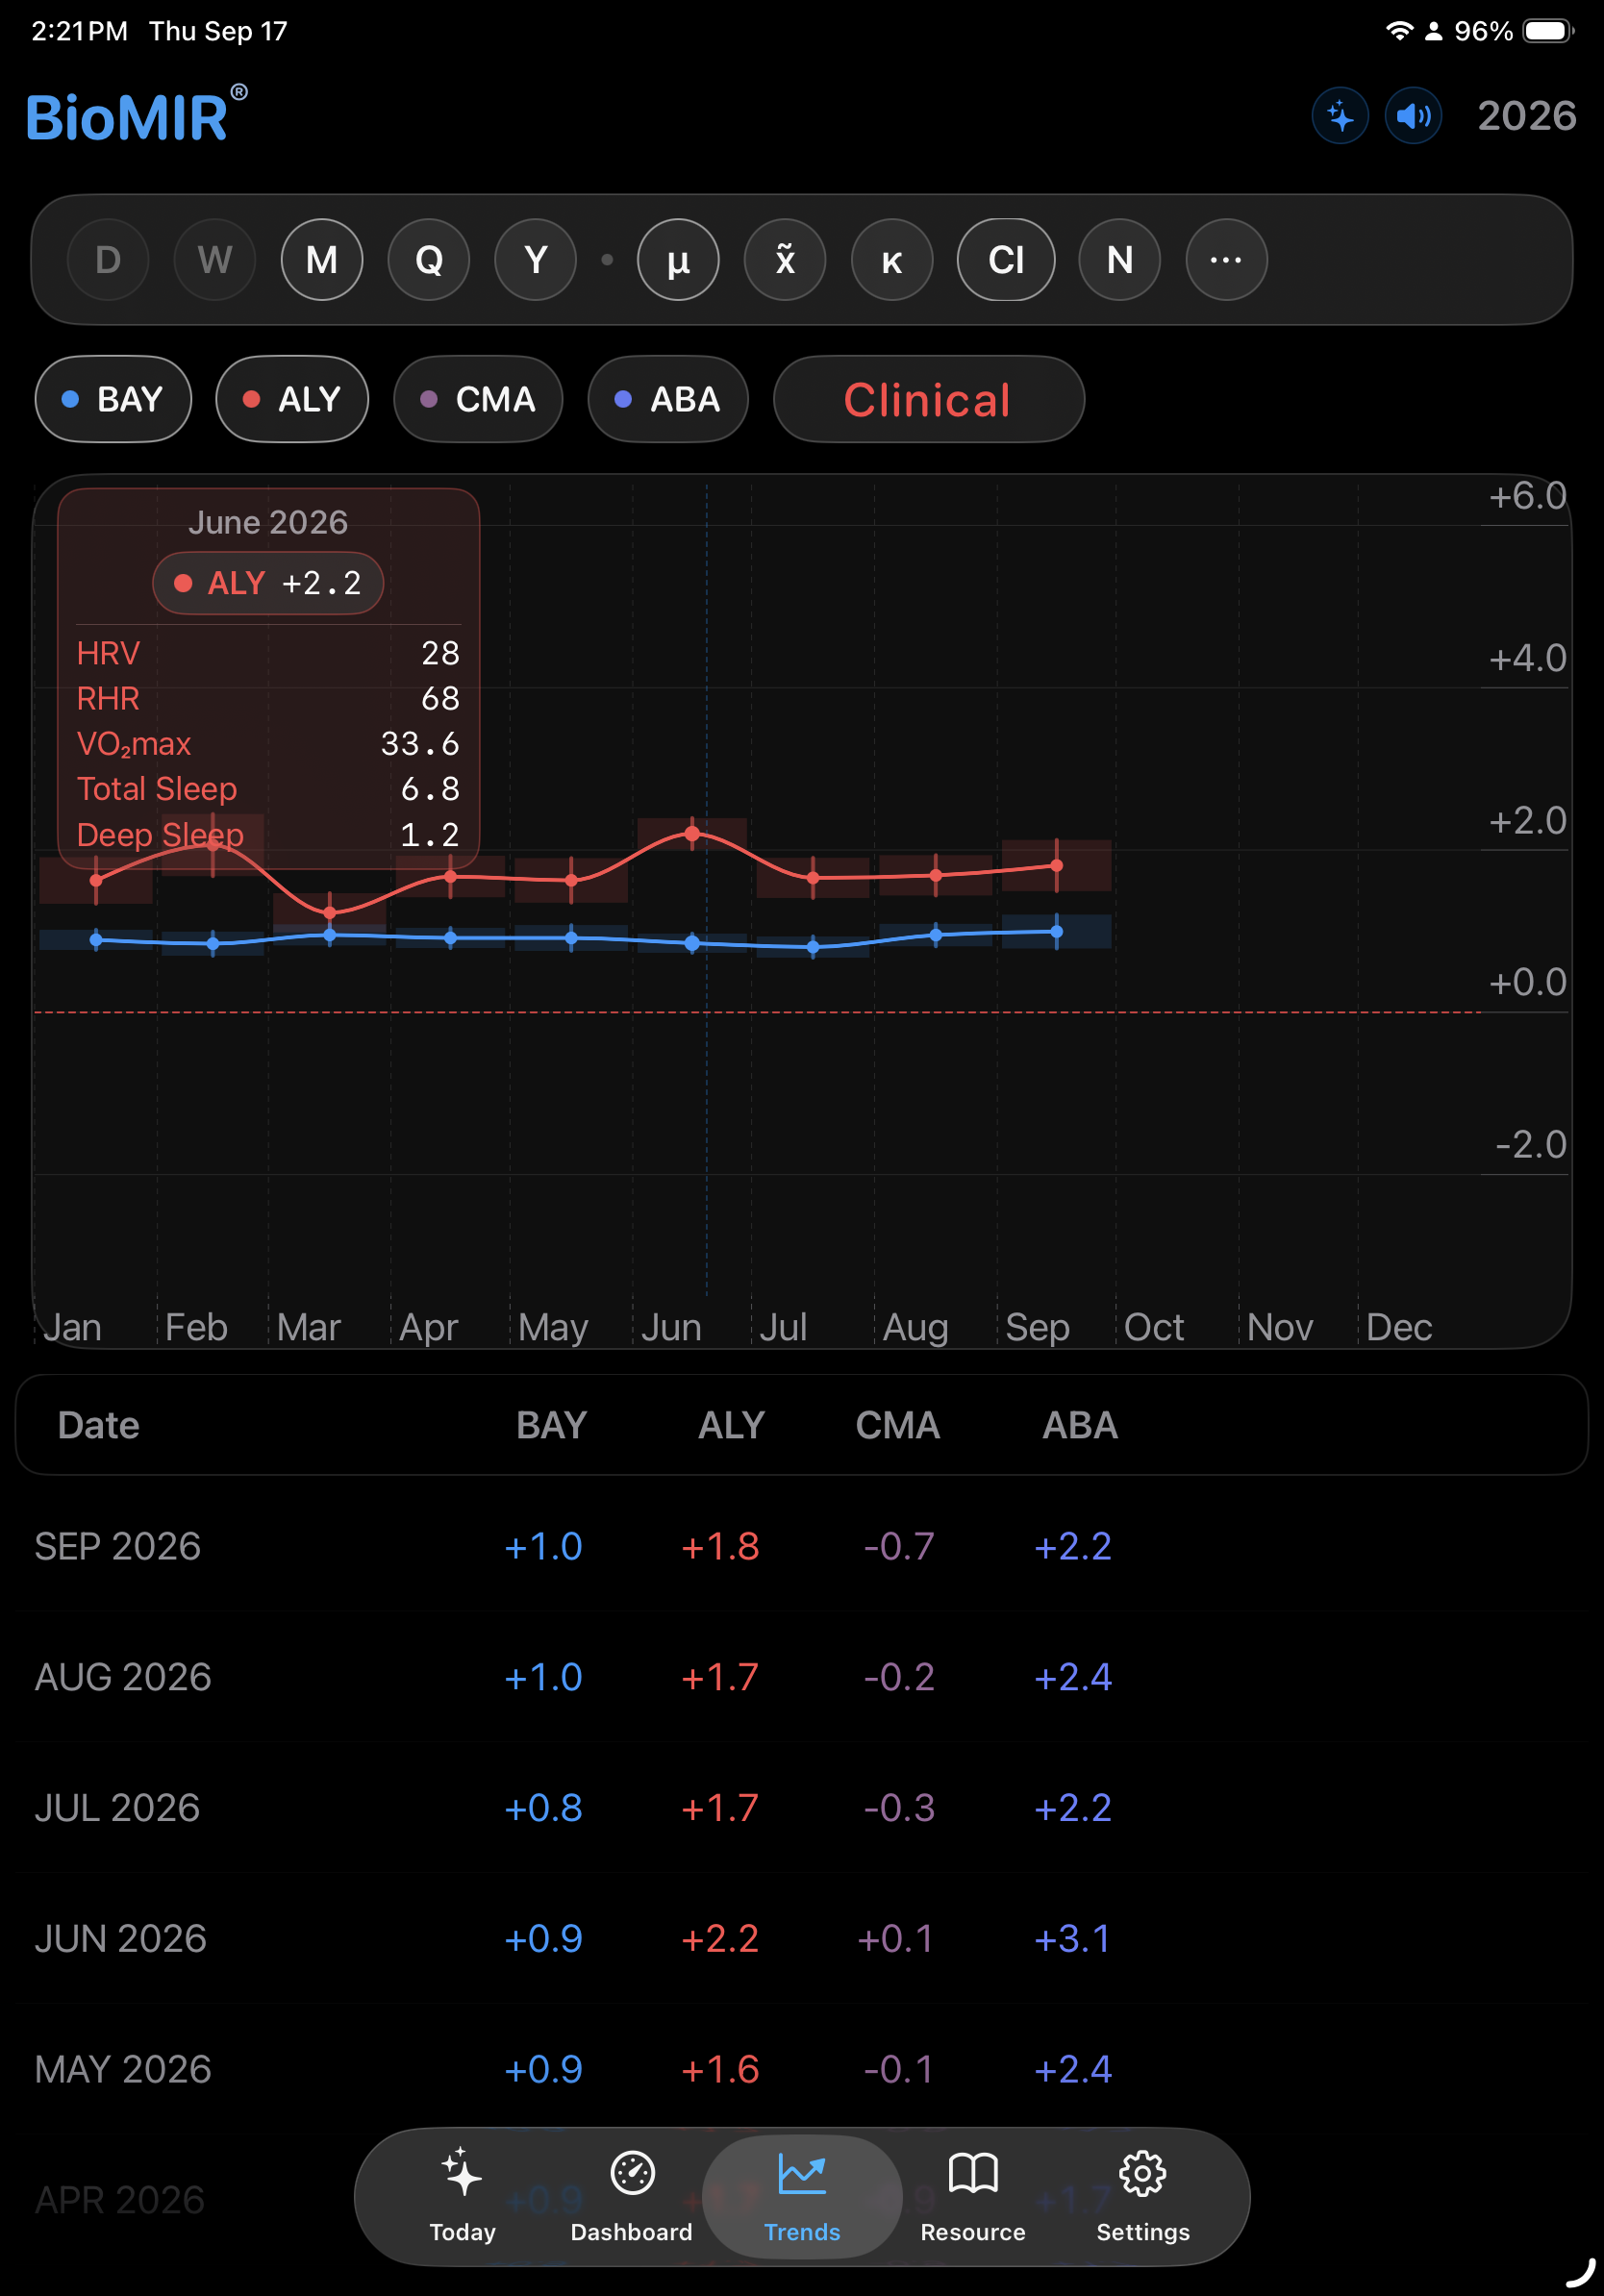
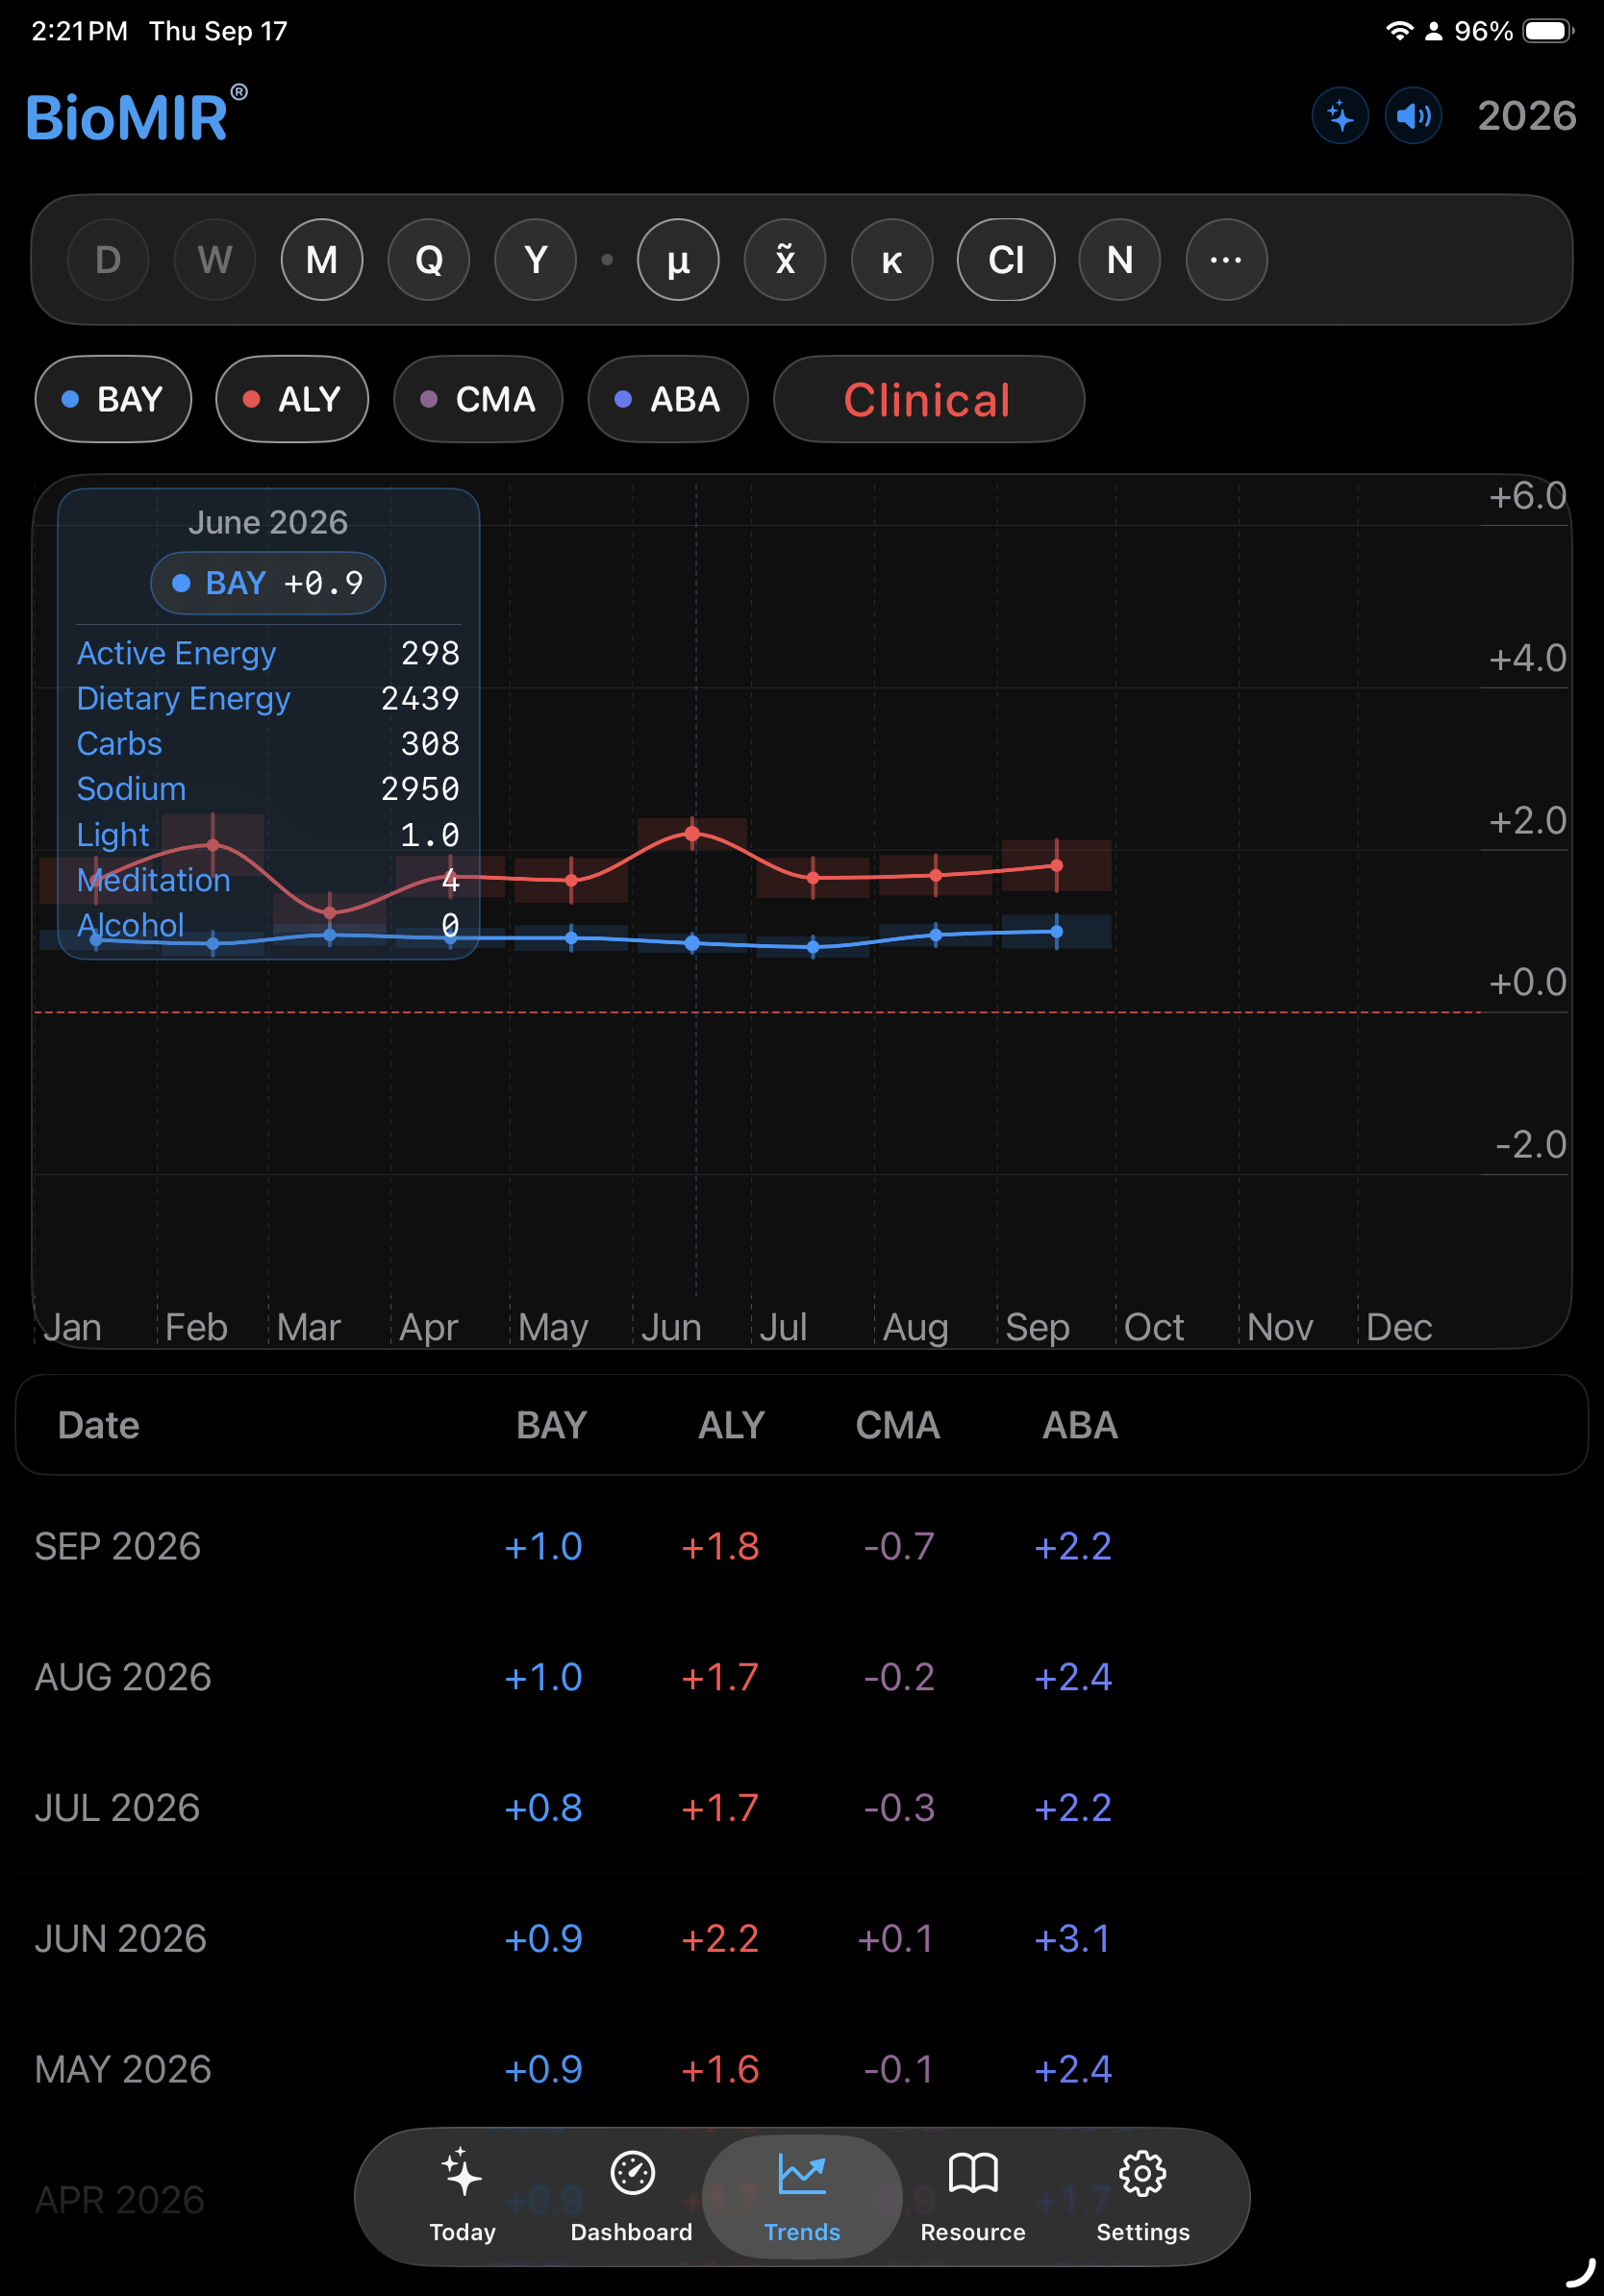
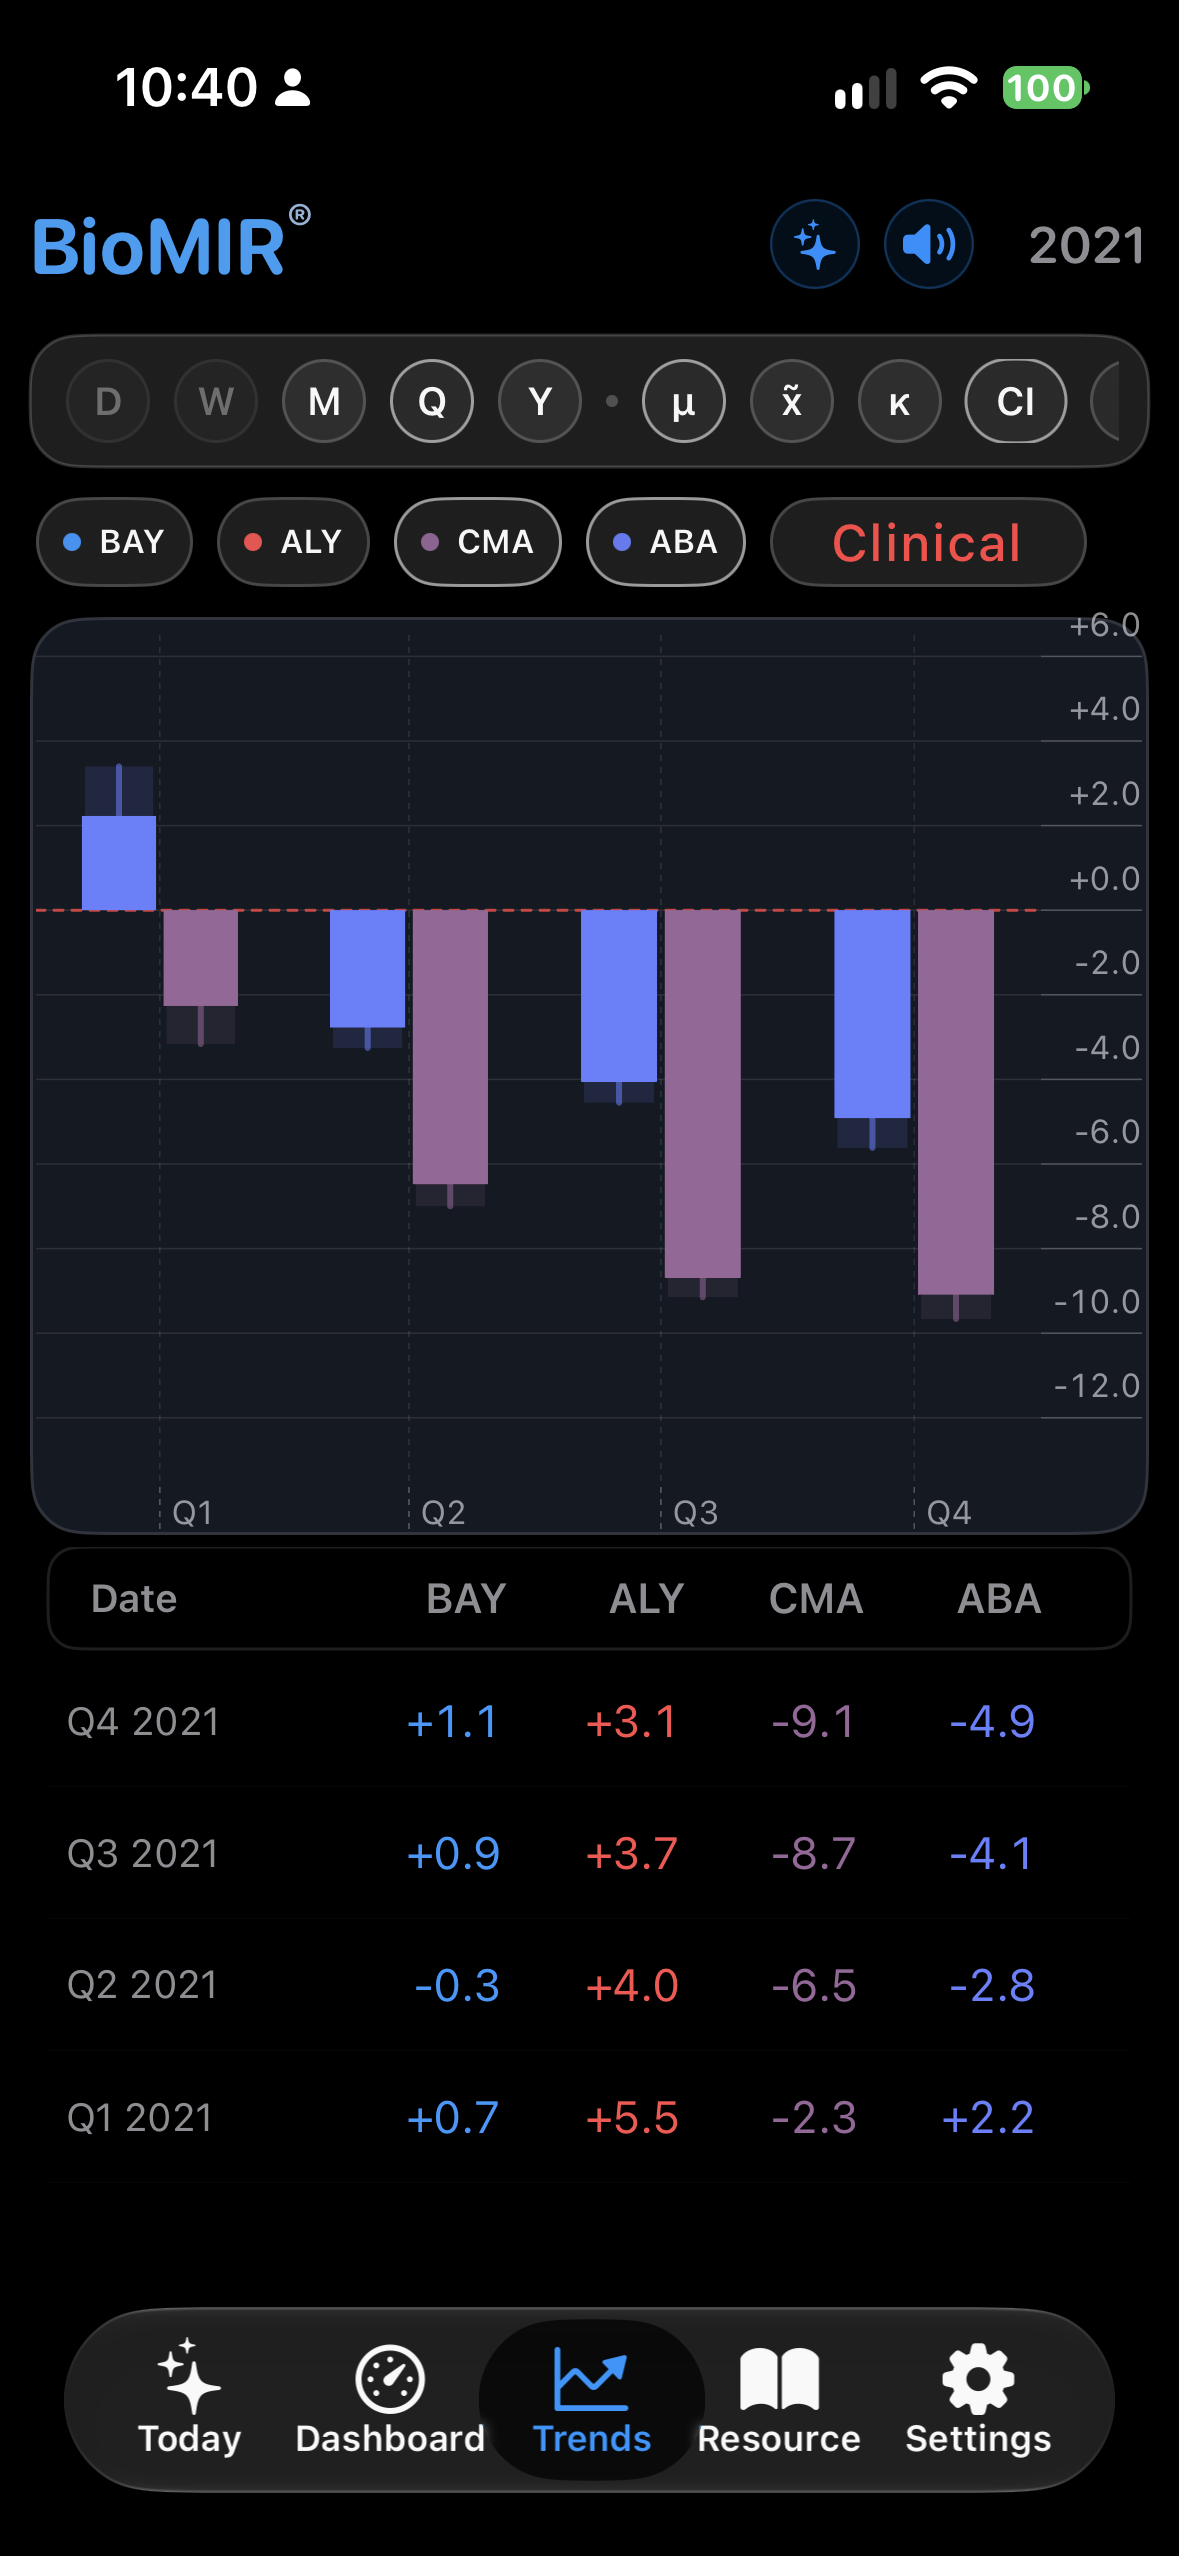
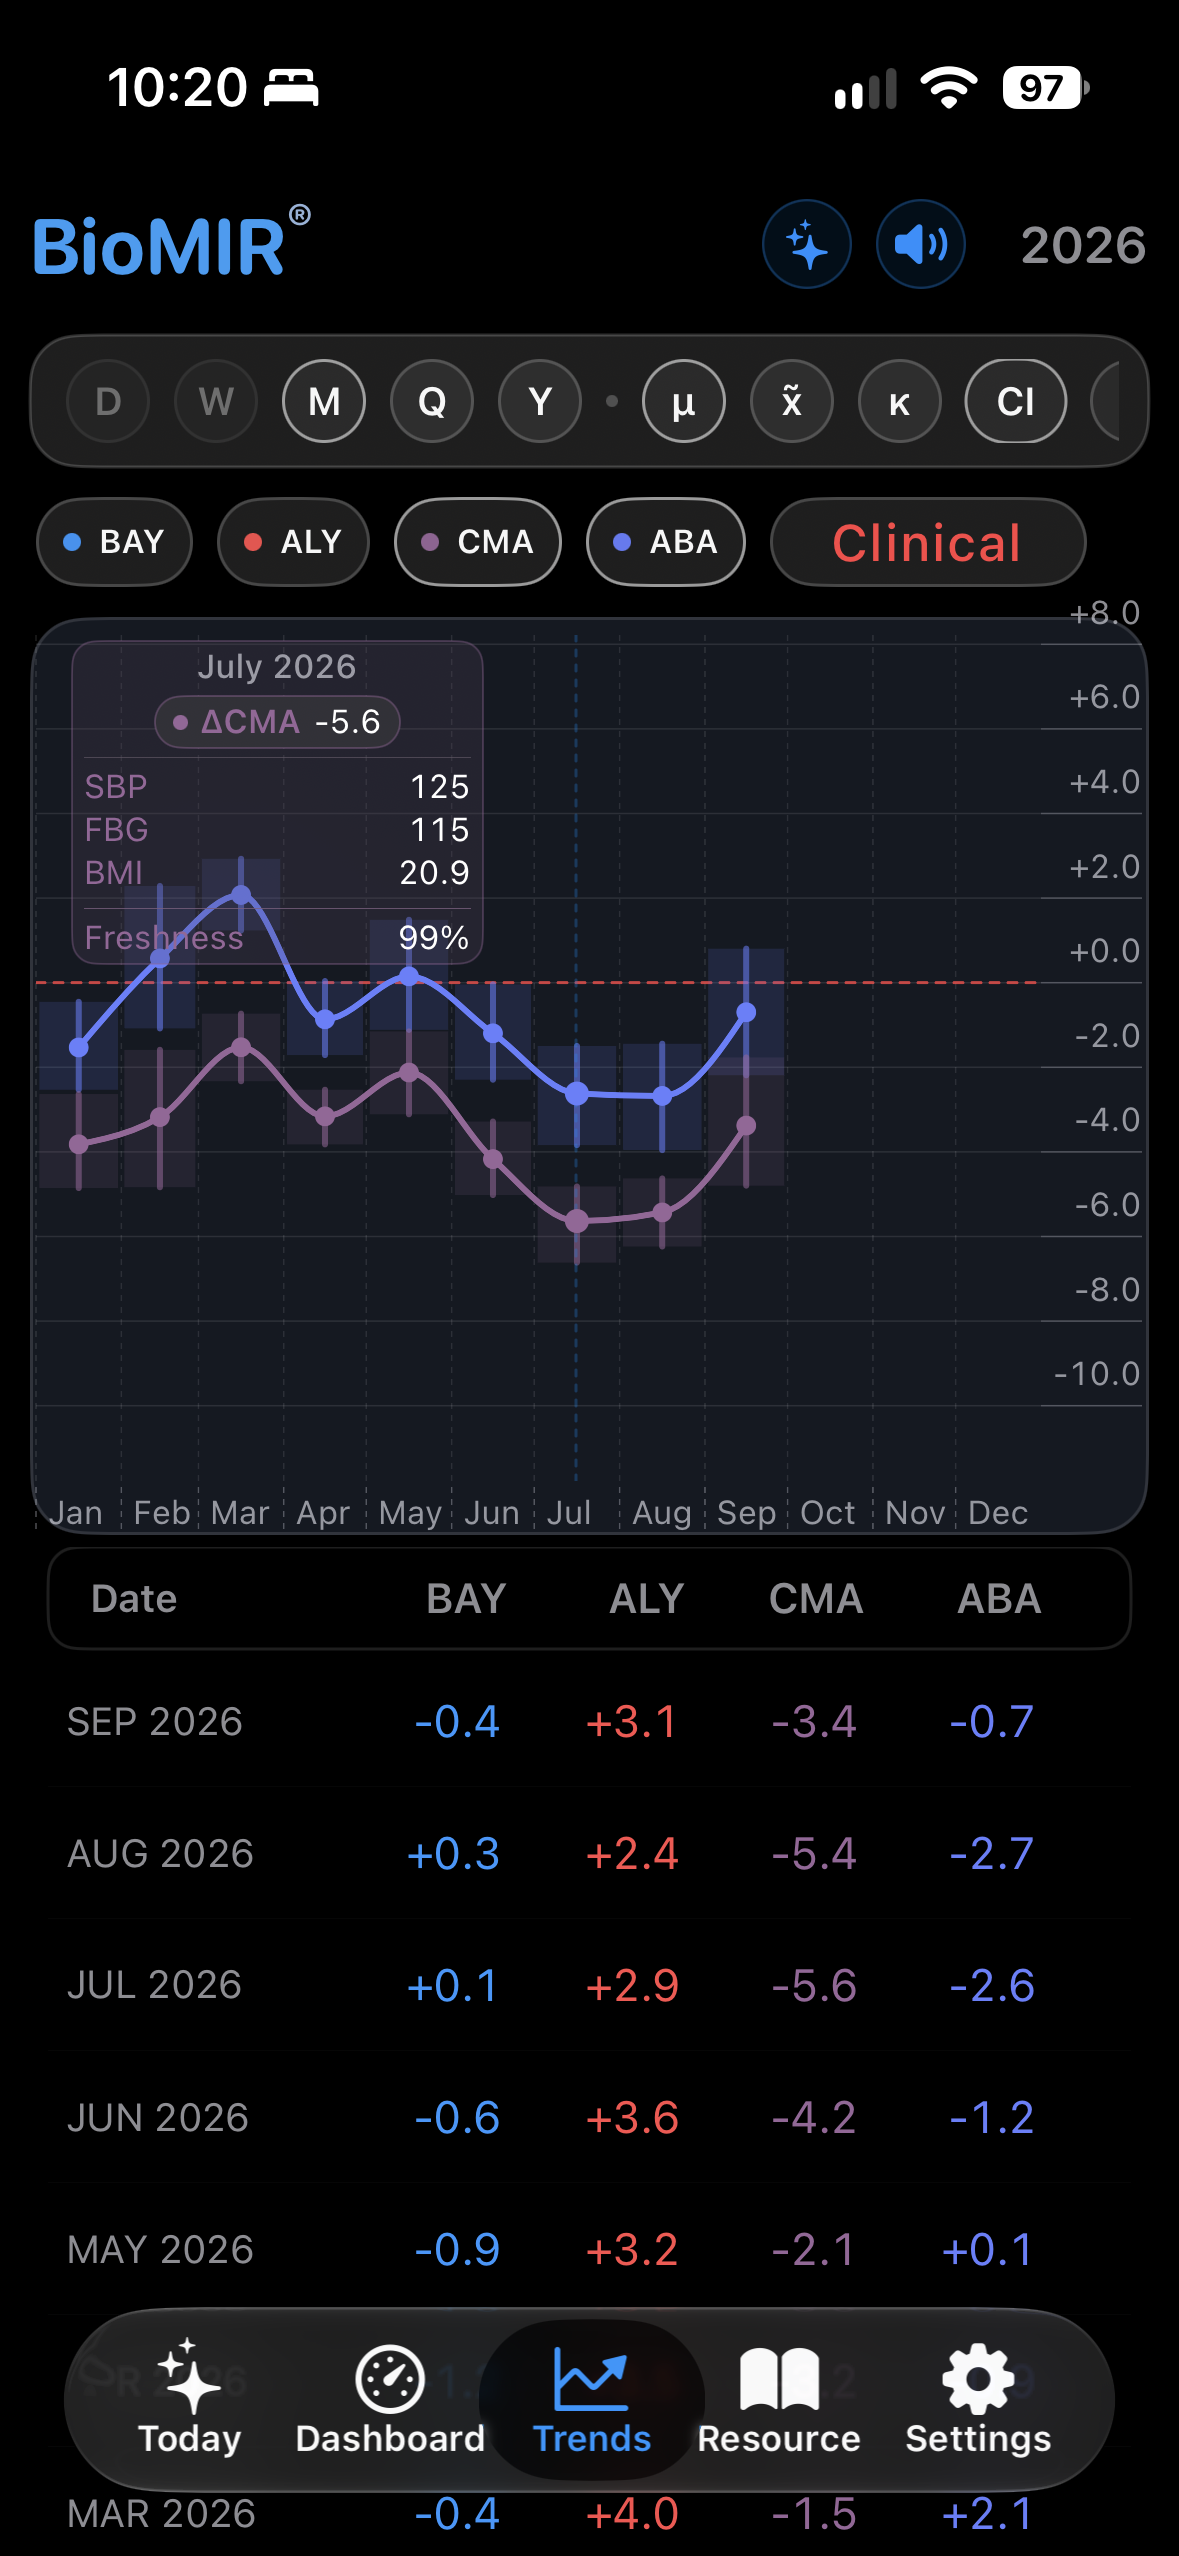
Trends is the longitudinal investigation environment. Follow domains and clocks across days, weeks, months, quarters, and years. The scrubbable biomarker hub is the investigation tool: move through time to interrogate a point and expose the measurements, biomarker and domain contributions, and data-quality context behind it.

Freshness shows how recent the cardiometabolic anchors are; Completeness shows how much weighted input evidence supports Adaptive BioAge. Compare trajectories with these quality signals to judge whether an apparent shift is supported by current, sufficiently complete data and whether it persists beyond short-term biological or measurement variation.

Trends · iPhone1 / 9
Swipe to explore · Tap to enlarge
03 / Across your devices

Built for the space
and the moment.

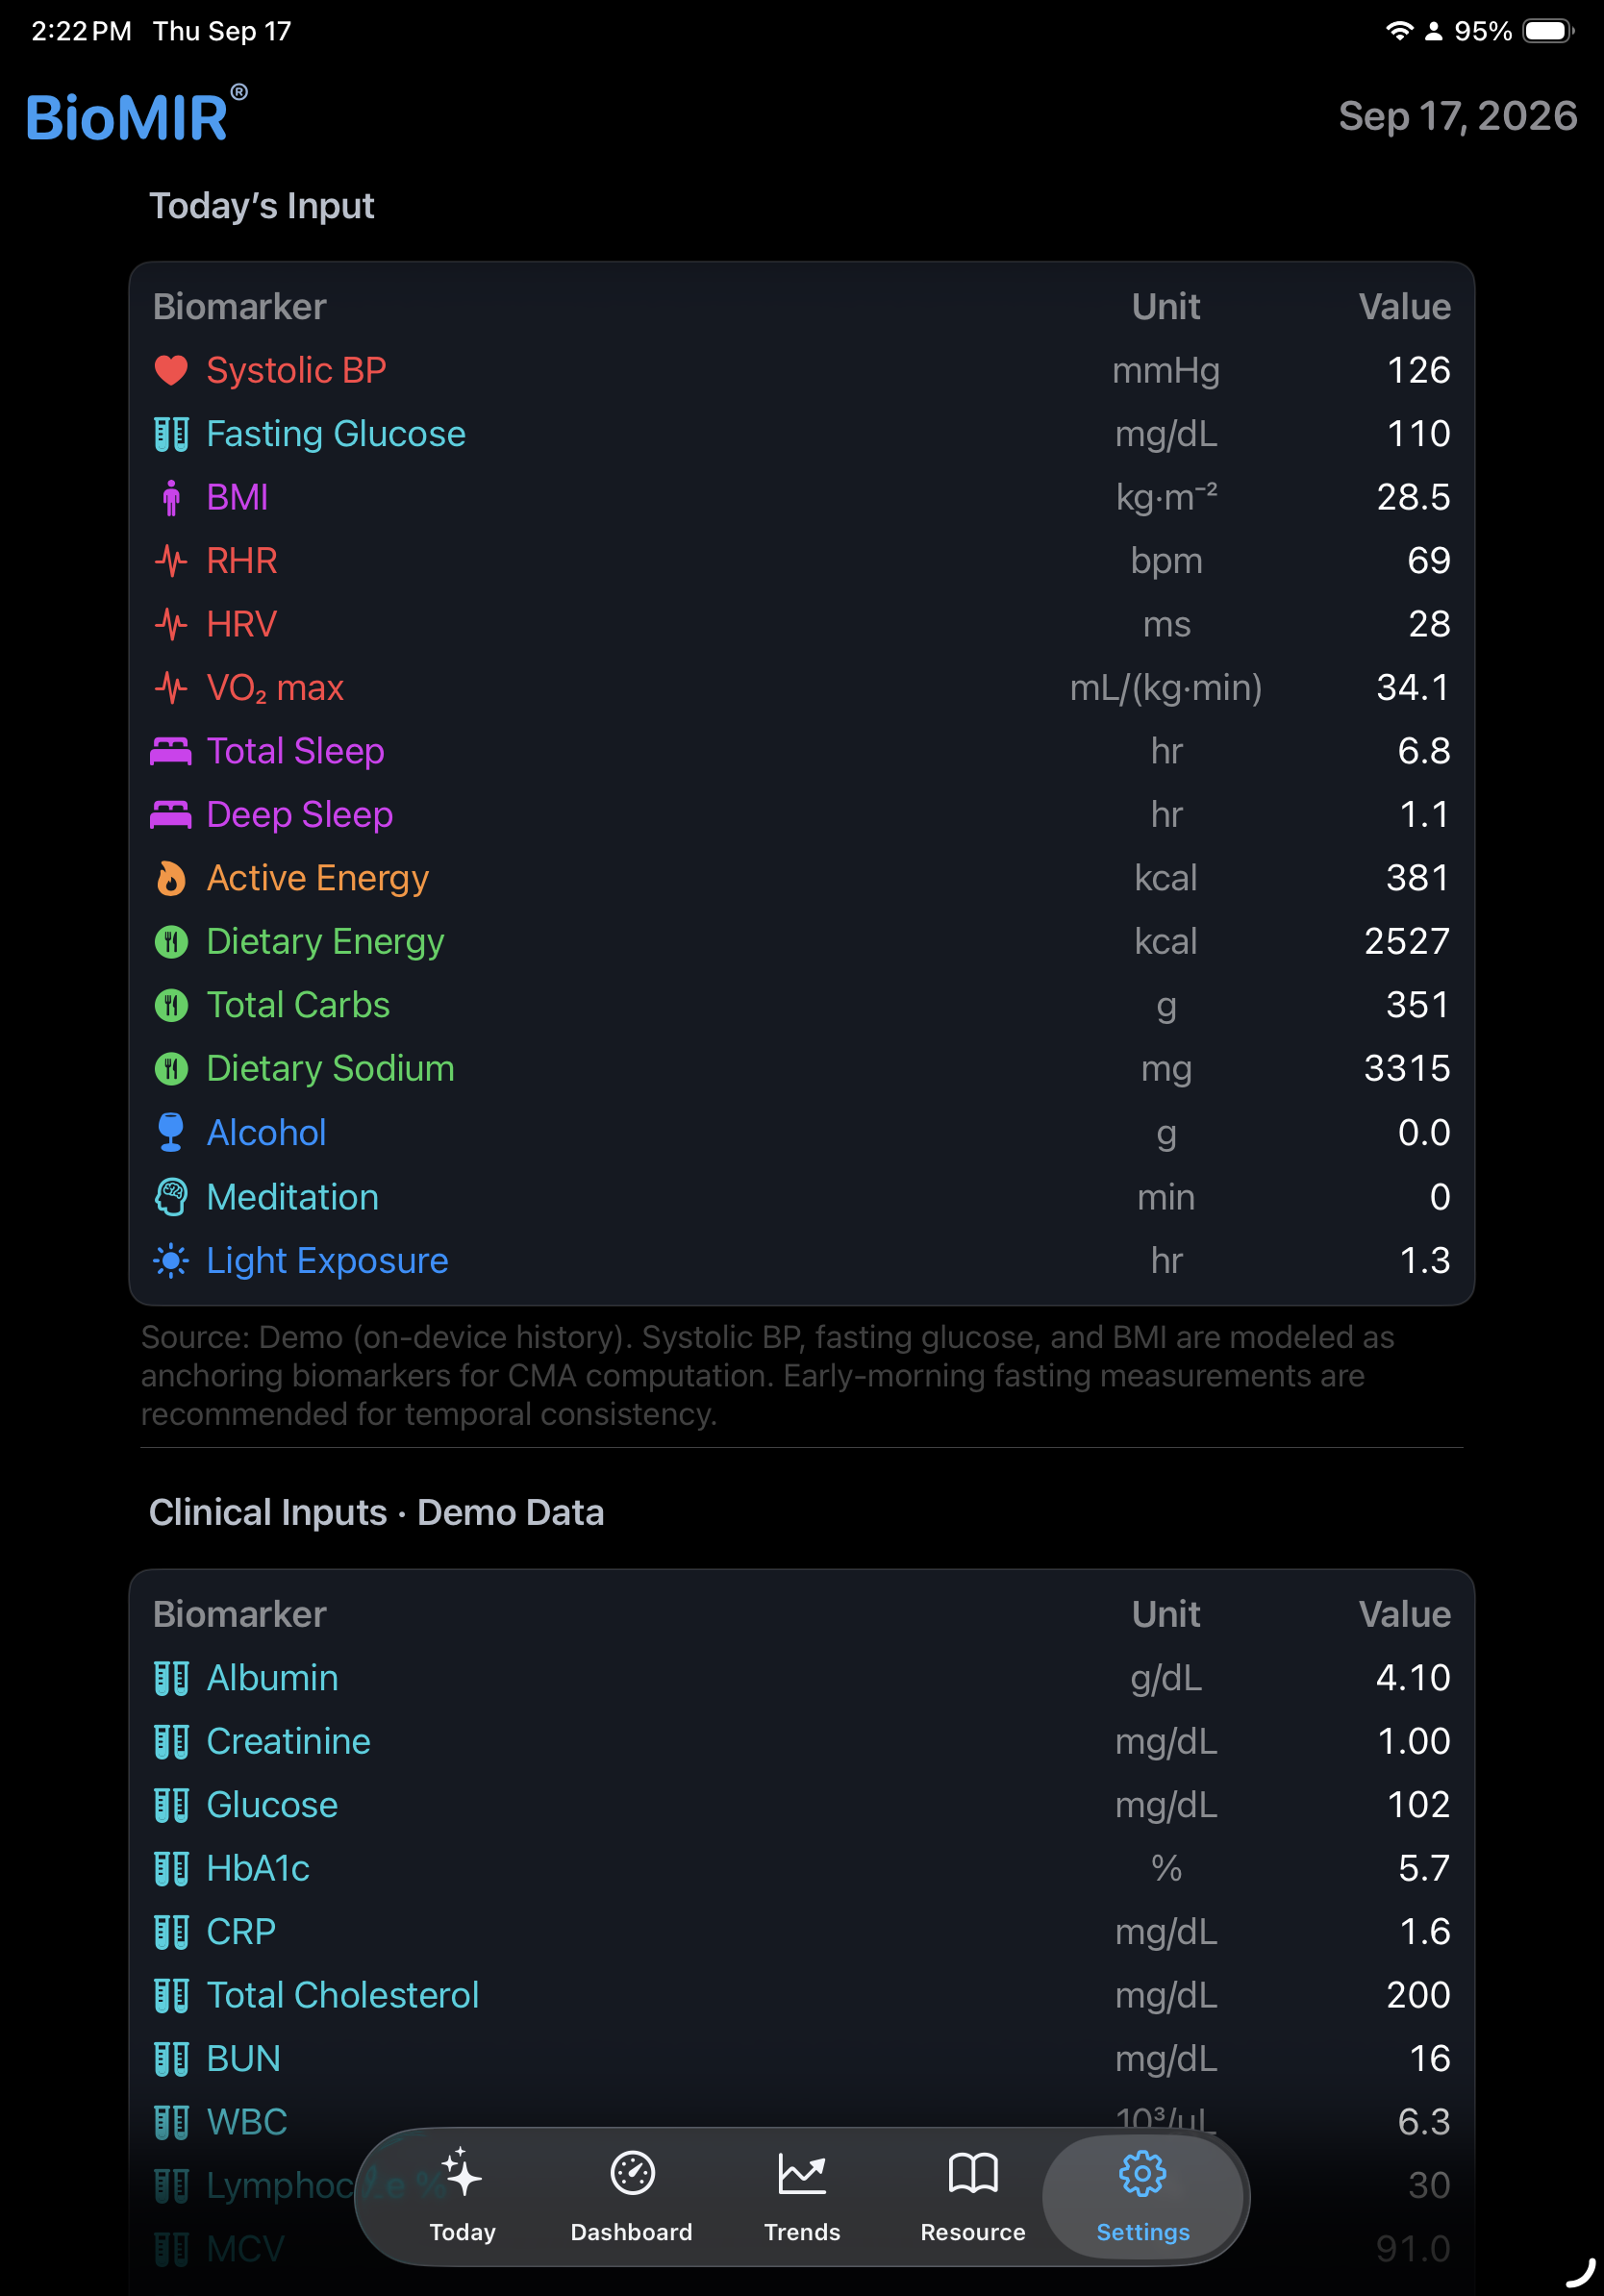
iPad · Today, Resource & Settings1 / 9
BioMIR Ipad screenshot 1
Today workspace
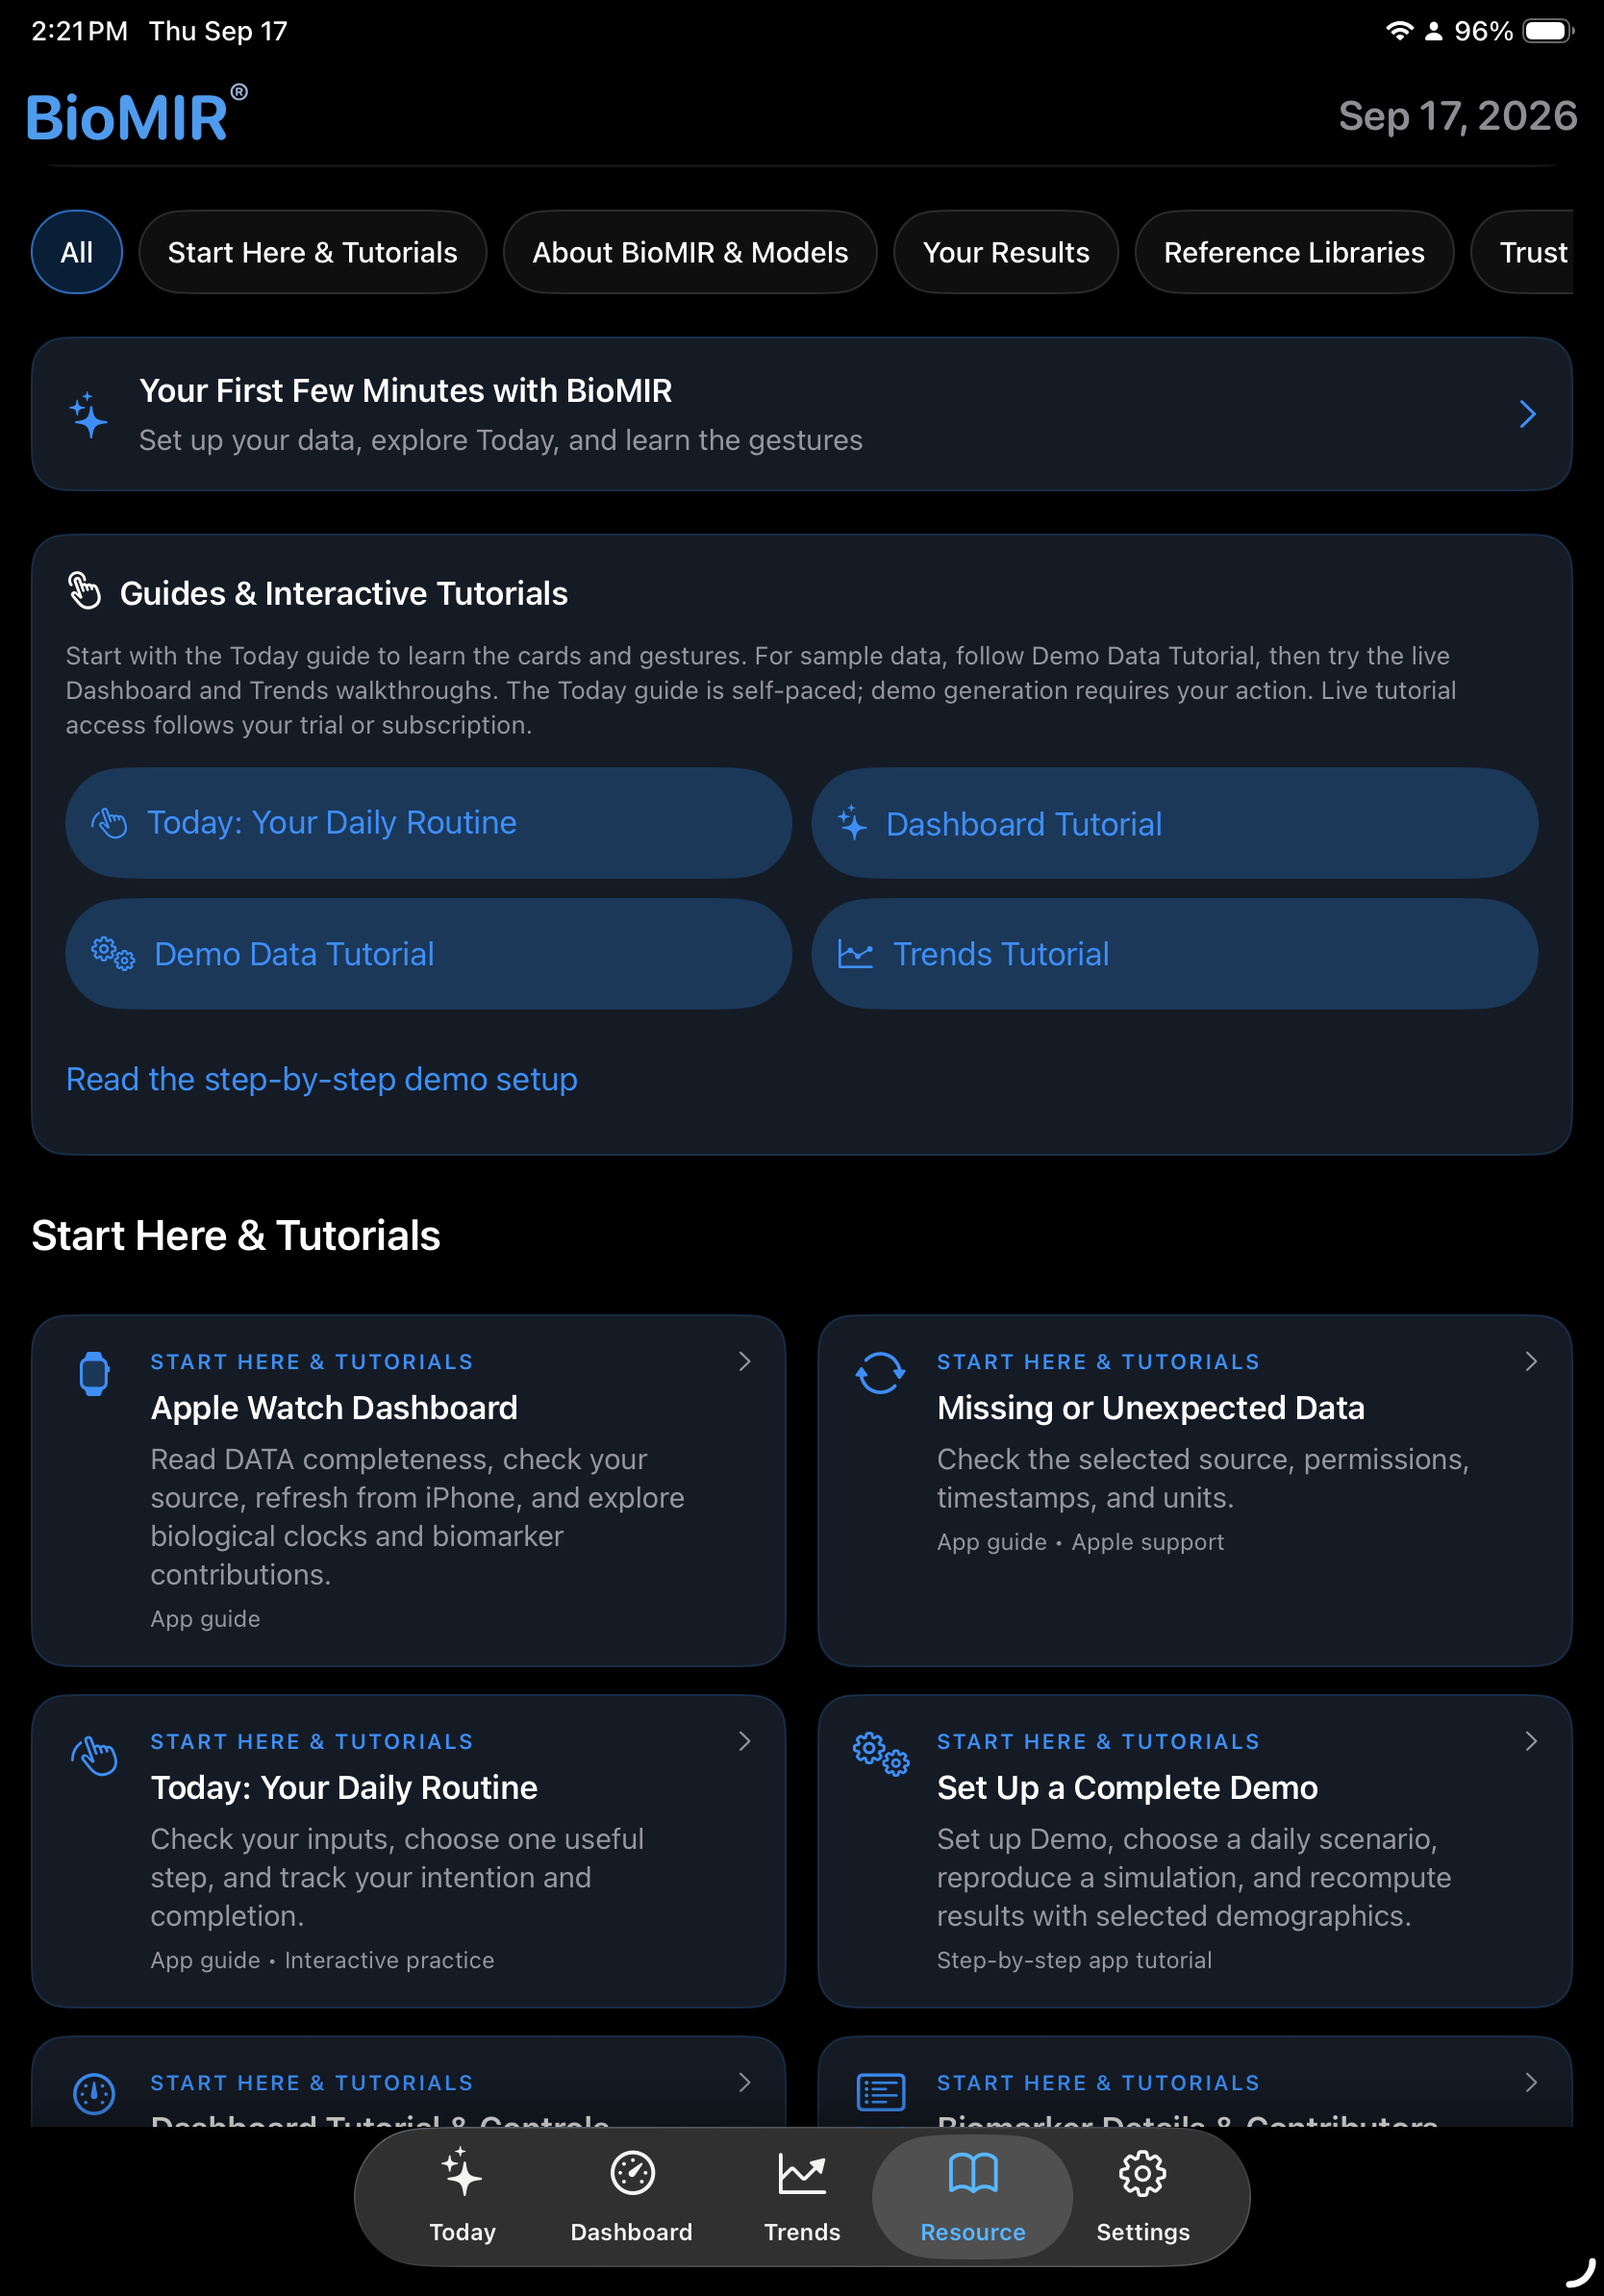
BioMIR Ipad screenshot 1
Today workspace
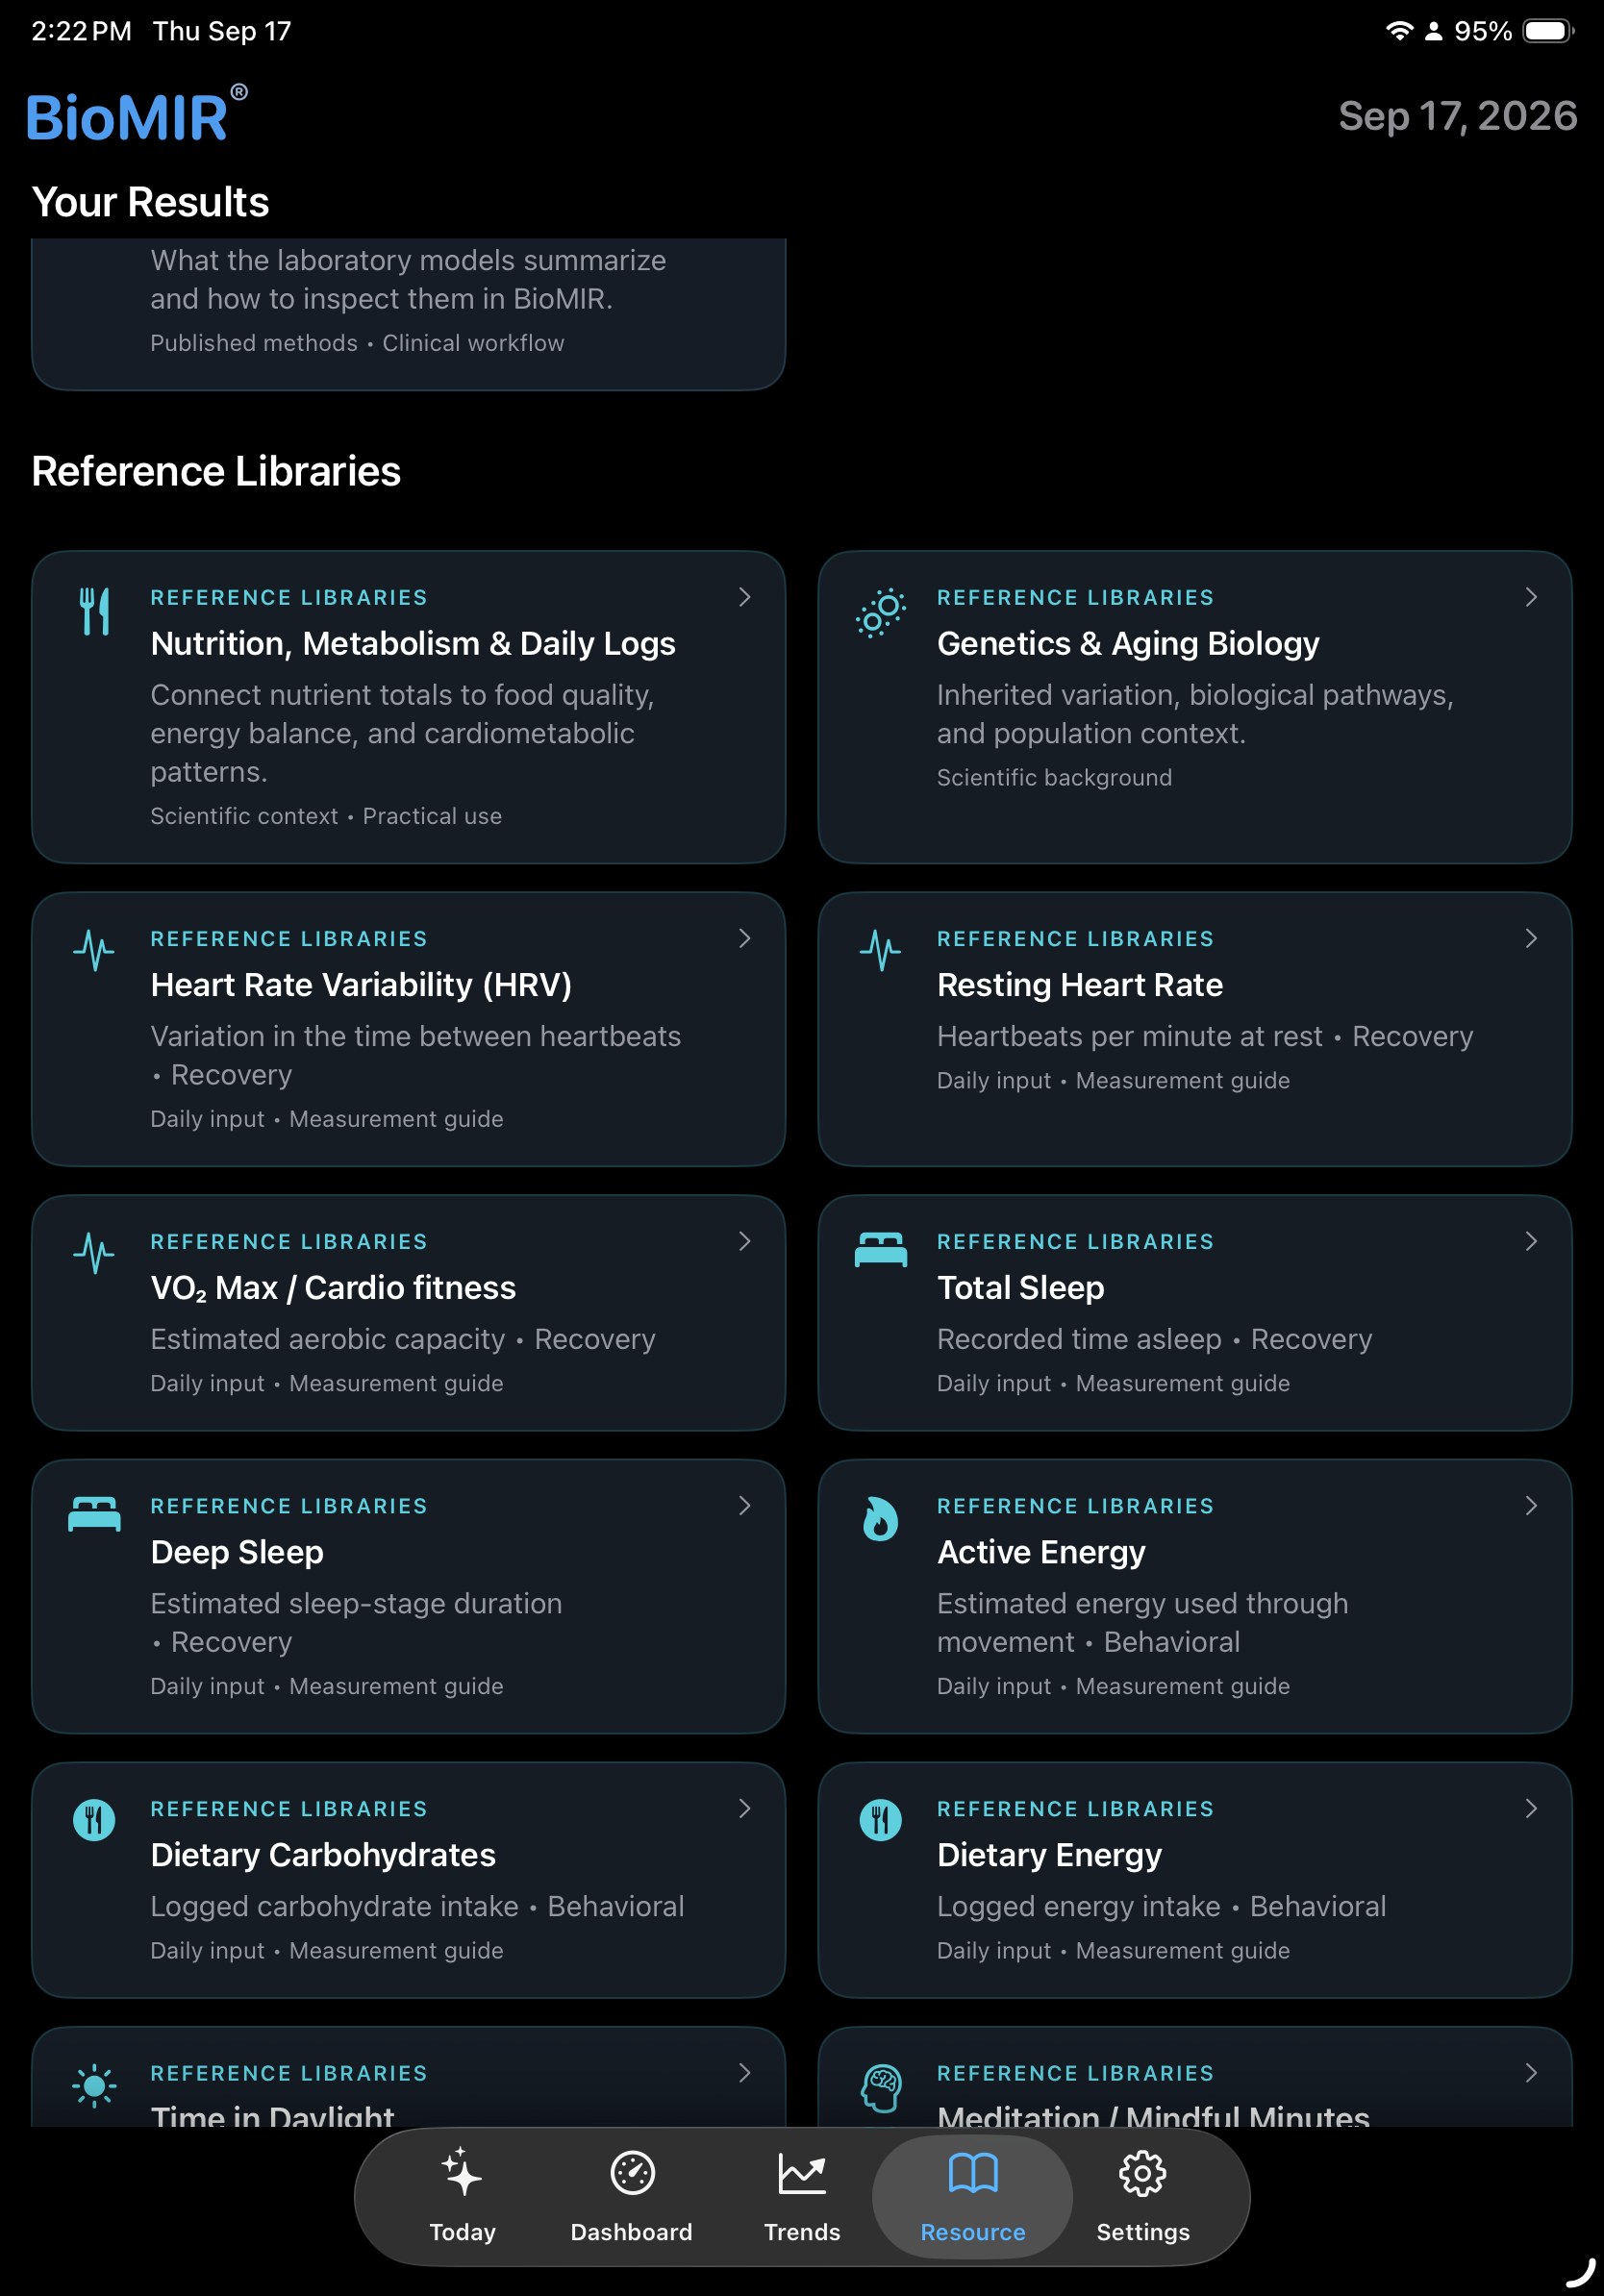
BioMIR Ipad screenshot 2
Today workspace
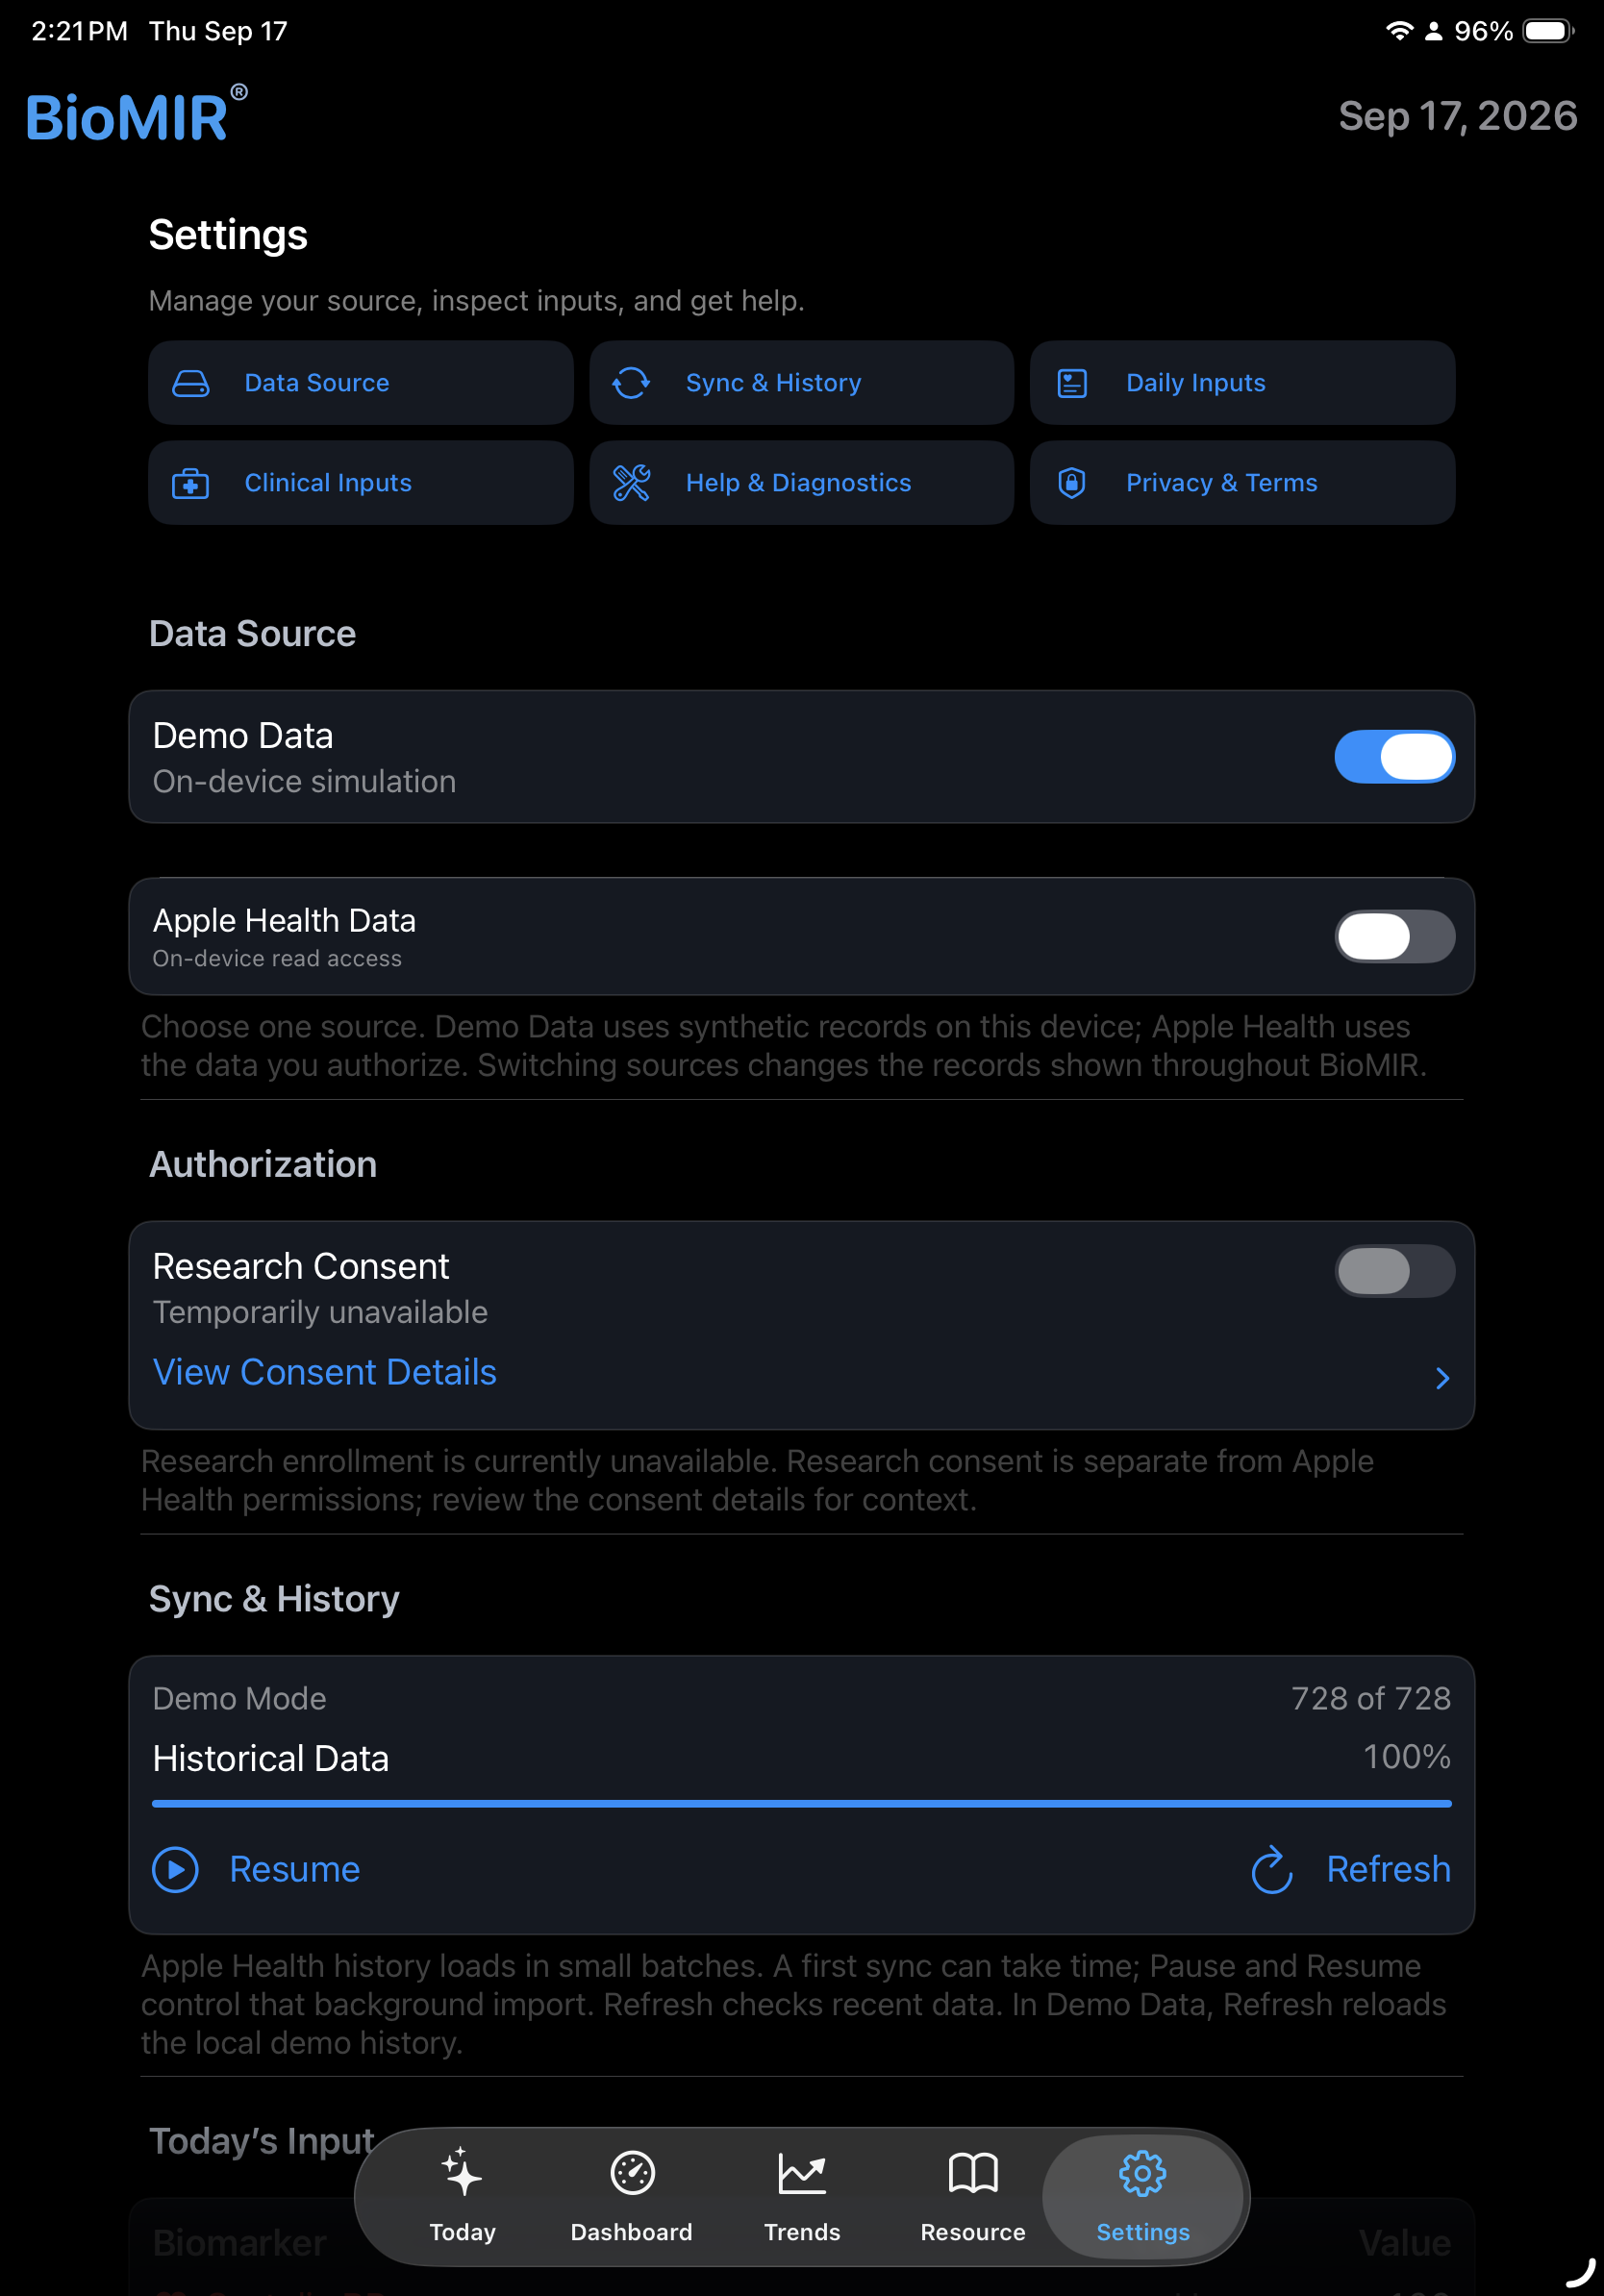
BioMIR Ipad screenshot 3
Today workspace
BioMIR Ipad screenshot 4
Today workspace
BioMIR Ipad screenshot 5
Today workspace
BioMIR Ipad screenshot 6
Today workspace
BioMIR Ipad screenshot 7
Today workspace
BioMIR Ipad screenshot 8
Today workspace
Swipe to explore · Tap to enlarge
iPhone

A configurable daily view with expandable cards, detailed contributors, action tracking, and trends.

iPad

A wider, expanded workspace for inspection. Today uses its own layout; it does not share the iPhone’s card expansion interaction.

Apple Watch

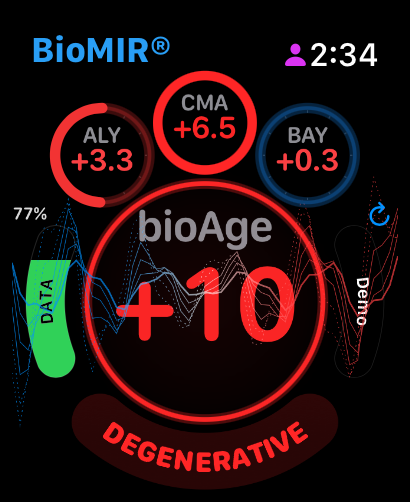
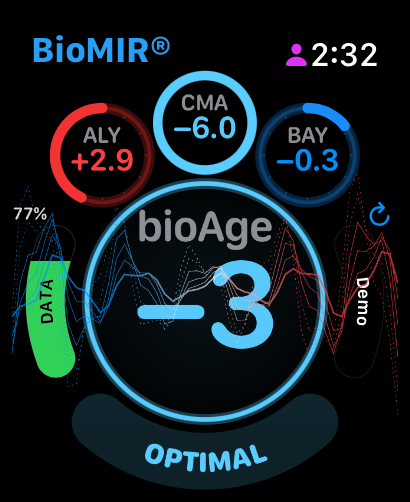
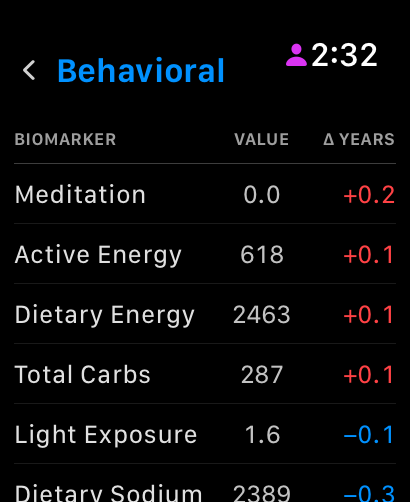
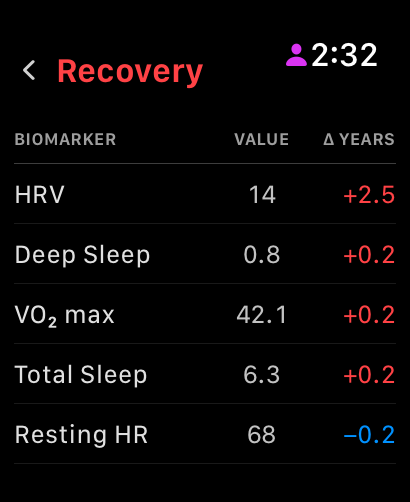
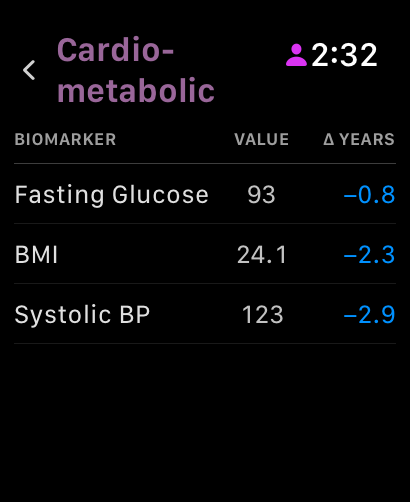
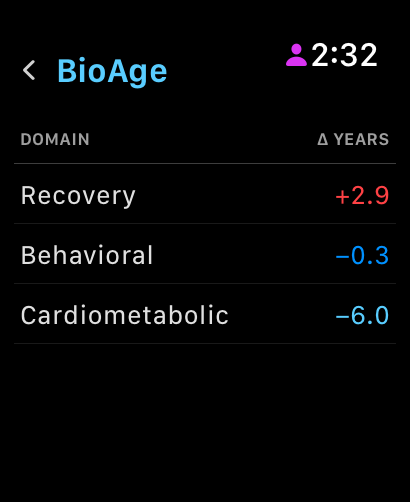
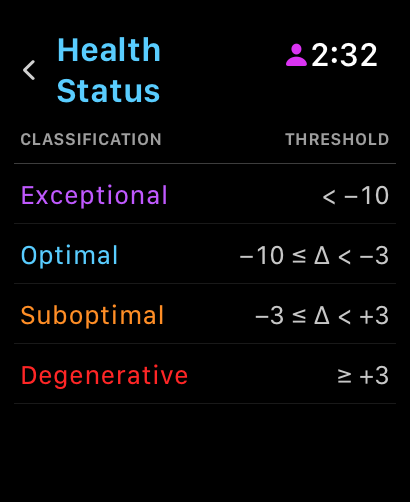
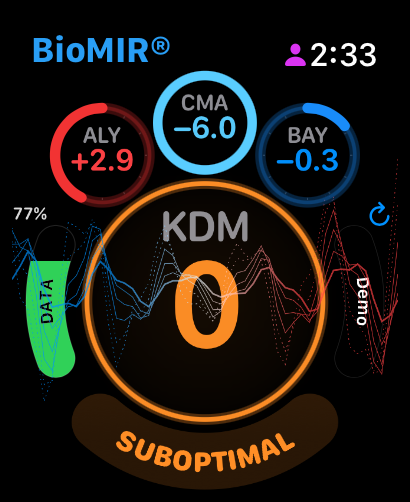
A companion snapshot supplied by the paired iPhone, including clocks, contributors, source, and coverage. Watch does not independently calculate the clocks.

04 / Apple Watch

Your snapshot.
On your wrist.

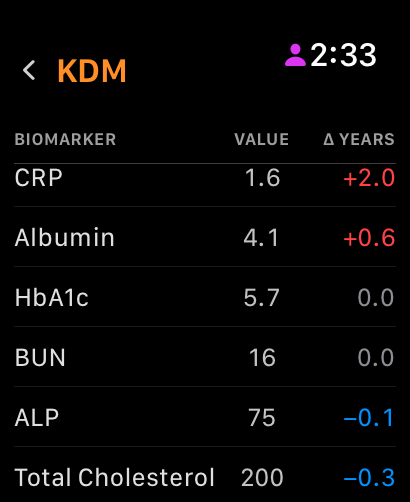
Review the snapshot supplied by your paired iPhone, then open Behavioral, Recovery, and Cardiometabolic contributors. The clock view also provides KDM context when available.

Check the source and data completeness alongside the result. Apple Watch presents the iPhone’s computed snapshot; it does not independently calculate the clocks.

Apple Watch1 / 9
BioMIR Apple Watch screenshot 1
Adaptive BioAge snapshot
BioMIR Apple Watch screenshot 2
Adaptive BioAge snapshot
BioMIR Apple Watch screenshot 3
Adaptive BioAge snapshot
BioMIR Apple Watch screenshot 4
Adaptive BioAge snapshot
BioMIR Apple Watch screenshot 5
Adaptive BioAge snapshot
BioMIR Apple Watch screenshot 6
Adaptive BioAge snapshot
BioMIR Apple Watch screenshot 7
Adaptive BioAge snapshot
BioMIR Apple Watch screenshot 8
Adaptive BioAge snapshot
BioMIR Apple Watch screenshot 9
Adaptive BioAge snapshot
Swipe to explore · Tap to enlarge
Explore with context

Get familiar.
Stay curious.

Try Demo Data

Explore simulated inputs and model responses before interpreting your own results. Demo values are examples, separate from Apple Health observations.

Understand the data practices

Core health calculations and the voice briefing run on device. Review the Privacy Policy and the App Store’s privacy disclosures for the applicable details.

See current availability ↗